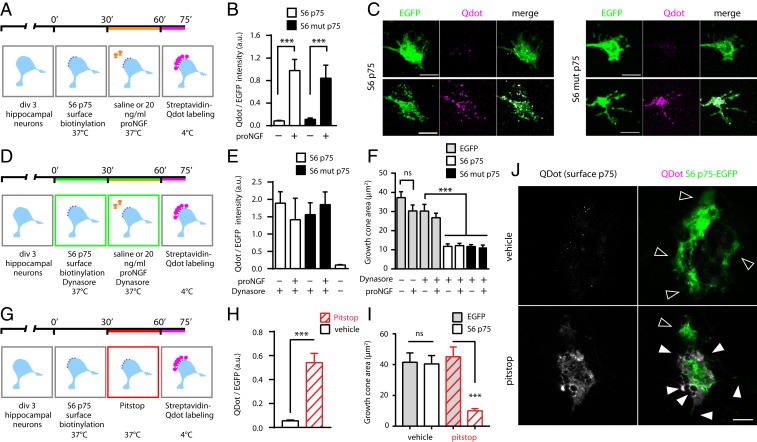
Fig. 7.
Surface-exposed p75NTR mediates growth cone collapse in the presence and absence of proNGF. (A) Timeline of the experiment to detect surface S6-p75NTR–GFP after proNGF administration. (B) Qdot-to-EGFP ratio is a measure of surface p75NTR-EGFP. Both wt p75NTR and mut p75NTR are enriched on the plasma membrane after 30 min of proNGF treatment. ***P < 0.001, Kruskal–Wallis test (Dunn’s multiple comparisons). Bars are mean ± SEM. a.u., arbitrary units. (C) Confocal images of growth cones of wt hippocampal neurons, transfected with S6-tagged wt p75NTR-EGFP (Left) and mut p75NTR-EGFP (Right) constructs, untreated (Top) or treated with proNGF for 30 min (Bottom). Total (green) and surface (magenta) receptor pools are shown, and are quantified in B. EGFP channel levels have been linearly scaled to highlight cone dimensions. (Scale bars, 5 μm.) (D) Timeline of the experiment with Dynasore internalization-inhibiting drug. (E) Dynasore increases the Qdot-to-EGFP ratio even without proNGF, confirming the retention of wt and mut p75NTR-EGFP on the plasma membrane. (F) Retention on the membrane is sufficient for wt p75NTR and mut p75NTR to cause growth cone collapse. Corresponding images are shown in SI Appendix, Fig. S11A. ***P < 0.001, 1-way ANOVA (Tukey’s multiple comparisons). ns, not significant at the 0.05 level. Bars are mean ± SEM. (G) Experimental timeline with Pitstop2 internalization-inhibiting drug. (H) Inhibiting clathrin-dependent internalization causes accumulation of surface p75NTR. ***P < 0.001, Welch’s test (2-tailed). (I) Retention of p75NTR is sufficient to cause growth collapse without proNGF. ***P < 0.001, 1-way ANOVA (Bonferroni multiple comparisons). Bars are mean ± SEM. (J) Representative neurons expressing S6-p75NTR–EGFP treated with Pitstop2 or vehicle. Highlighted are extended (empty arrowheads) and collapsed (filled arrowheads) growth cones. Collapsed growth cones show increased surface p75NTR levels, suggesting a cone-autonomous mechanism. (Scale bar, 10 μm.)

