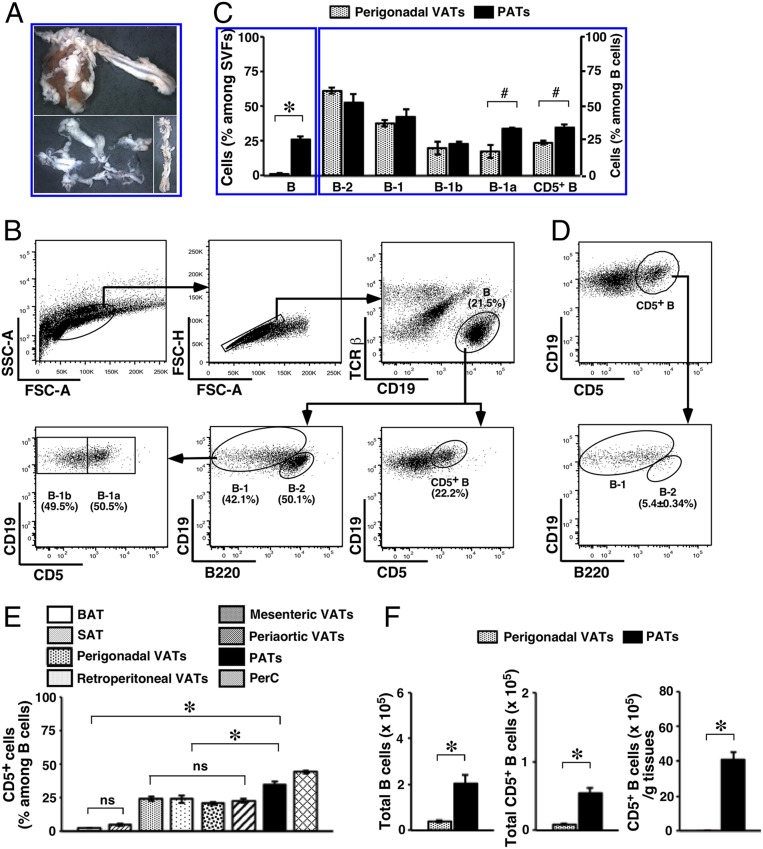
Fig. 1.
B cell subsets in PATs. Adult WT B6 mice were used. (A) A heart and thoracic aorta with surrounding VATs are shown (Upper). PATs together with pericardium (Lower Left) or periaortic VATs (Lower Right) are shown (magnification: 0.5×). (B) Flow cytometry gating schemes for B cell subsets among SVFs are shown. (C) B cells (Left) and their subsets (Right) in the indicated adipose depots were examined (summary of 2 independent experiments, n = 8). (D) Representative flow cytometry plots are shown for the distribution of B-1 and B-2 cells among CD5+ B cells in PATs. (E) The frequency of CD5+ B cells in the indicated adipose depots and PerC were analyzed (summary of 2 independent experiments, n = 8). (F) Total B and CD5+ B cells (Left and Center), and CD5+ B cells per unit of tissues (Right) were compared between the indicated VAT depots (summary of 2 independent experiments, n = 8). #P < 0.05; *P < 0.01; and ns, not statistically different; for all of the panels.

