Fig. 3.
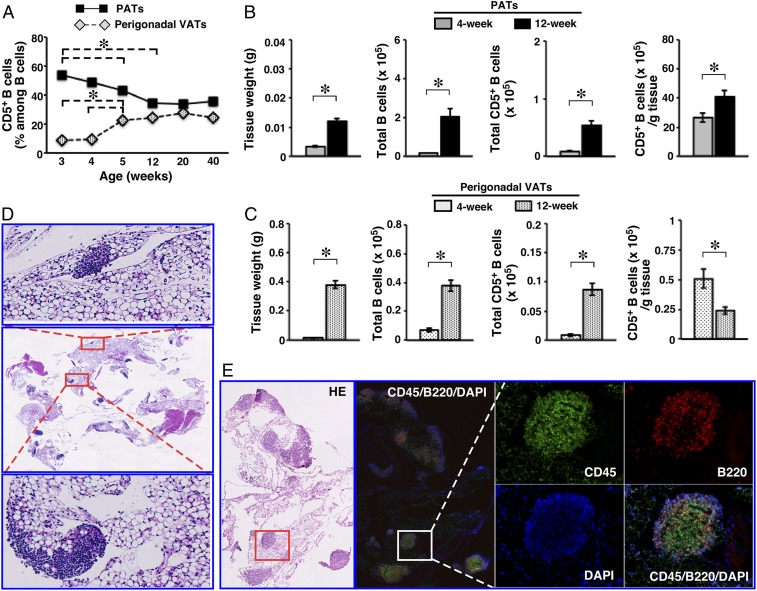
Dynamics and residence of B cells in PATs. WT B6 mice were used. (A) Frequencies of CD5+ B cells in the indicated adipose depots were examined at the indicated ages (summary of 2 independent experiments, n = 8 for each age). (B and C) The indicated parameters for B cells were examined in the indicated adipose depots of mice at 4 and 12 wk of age (summary of 2 to 3 independent experiments, n = 11 to 14). (D) Paraffin-embedded sections of PATs together with pericardium were stained with H&E (magnification: 0.5×). Two areas with densely packed cells are enlarged to show clusters. Representative graphs from 3 independent experiments are shown (n = 6). (E) Frozen sections of PATs together with pericardium were either stained with H&E or immunostained for the indicated markers (magnification: 4×). One area containing a FALC is enlarged to illustrate B cells. *P < 0.01 for all of the panels.

