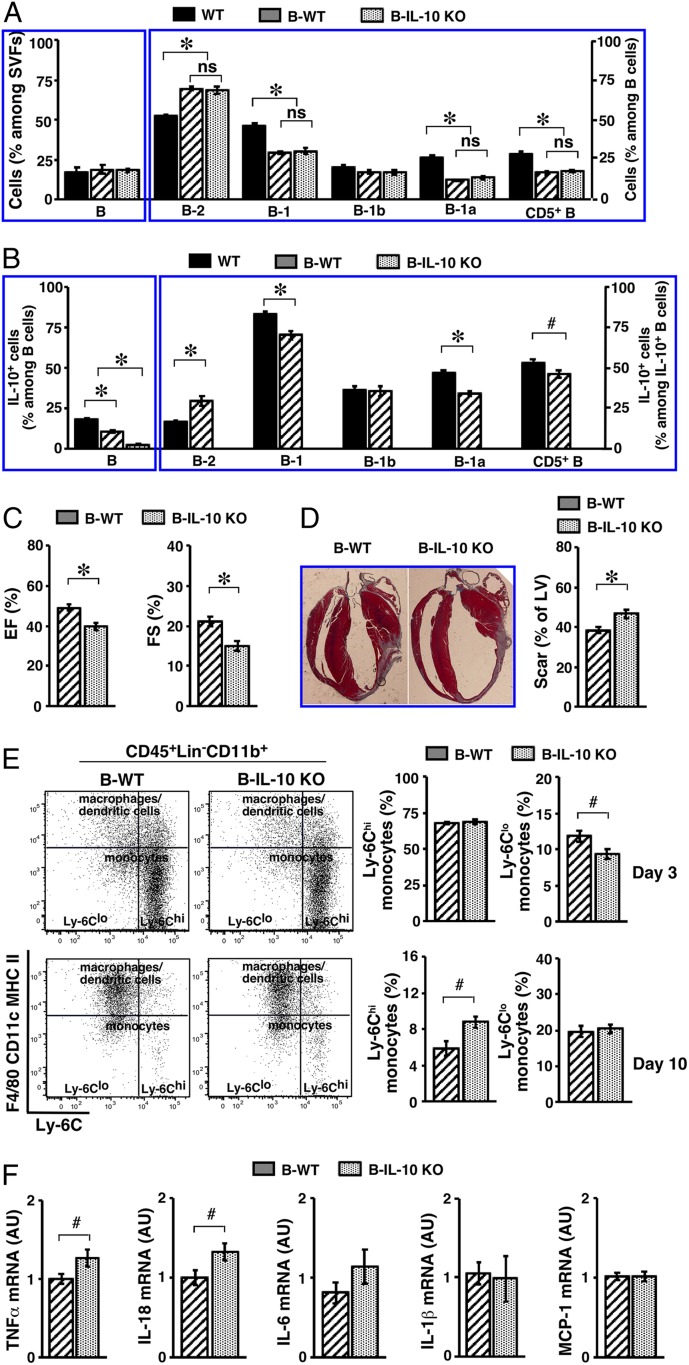
Fig. 7.
Impact of B cell IL-10 deficiency on the outcome of acute MI. (A) WT B6 mice were either left untreated (WT), or underwent bone marrow transplantation to generate B-WT or B-IL-10 KO mice. SVFs from PATs were analyzed for frequencies of B cells (Left) and their subsets (Right). Summary of 2 independent experiments (n = 5 to 7) is shown. (B) Mice were treated as described in A. SVFs from PATs were cultured as described in the legend for Fig. 2B, in the presence of PIL. Cells were examined for IL-10+ B cells (Left) and subset distribution among IL-10+ B cells (Right). A summary of 2 independent experiments is shown (n = 5 to 7). (C) B-WT and B-IL-10 KO mice underwent MI surgery, and were examined for LV function by echocardiography 3 wk later. Ejection fraction (EF, Left) and fractional shortening (FS, Right) are shown (n = 13 to 17). (D) Mice were treated as described in C, and were killed 3 wk later. Representative images of Masson’s trichrome stain are shown (Left) (magnification: 0.5×). Scar areas were measured and are presented as percent of LV circumference (Right) (summary of 3 independent experiments, n = 17). (E) Mice underwent MI and were killed at the indicated time points postsurgery. SVFs from LVs were analyzed for subsets of monocytes. Representative flow cytometry plots at the indicated time points are shown (Left). Frequencies of monocyte subsets at the indicated time points are shown (Right) (summary of 2 independent experiments, n = 8 for each time point). (F) Transcripts of the indicated genes in LVs of mice were examined by real-time PCR 2 wk post-MI. Summary of 2 independent experiments is shown (n = 7 to 11). #P < 0.05 and *P < 0.01 for all panels.

