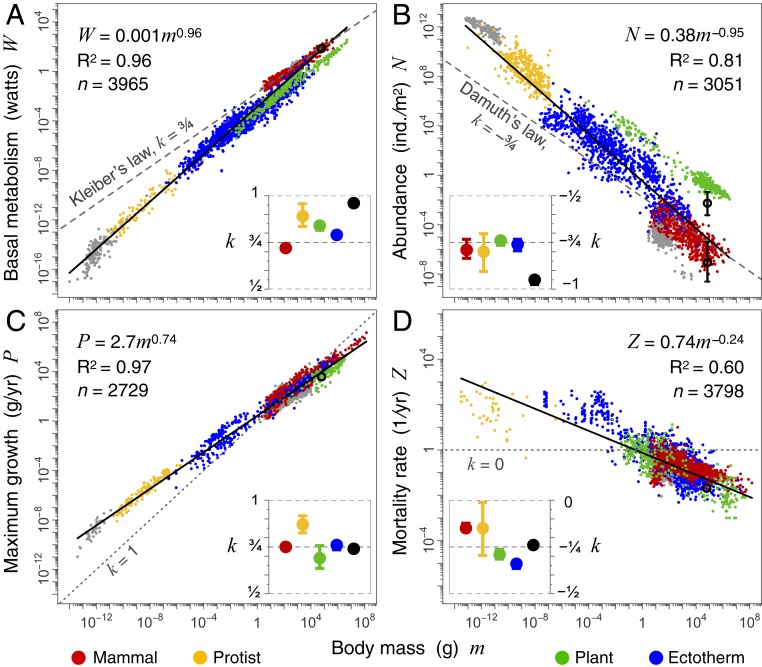
Fig. 1.
Scaling of basic variables with body mass. (A) Basal metabolism, (B) population abundance, (C) maximum growth, and (D) mortality rate. Points (n) in all plots (A–D) are separate species values, except for plants represented by multiple points for the same species. Ectotherms and protists were also not aggregated into species values in D, due to limited mortality data among smaller sized species. For illustration, we have split eukaryotes into mammals, protists, plants, and ectotherm vertebrates and invertebrates. More resolved groups down to taxonomic orders are detailed in SI Appendix, Figs. S1–S3 and Tables S1–S4. Birds (gray points) often have similar rates to mammals and thus are difficult to see in the plots (SI Appendix). We show bacteria (also gray points) for reference, where available, but limit our discussion to eukaryotes. Scaling exponents k and 95% CIs are shown in the insets for major groups (these exclude birds and bacteria). Black empty circles are humans, with ranges shown in B for cities and hunter-gatherer communities (not included in the analysis).

