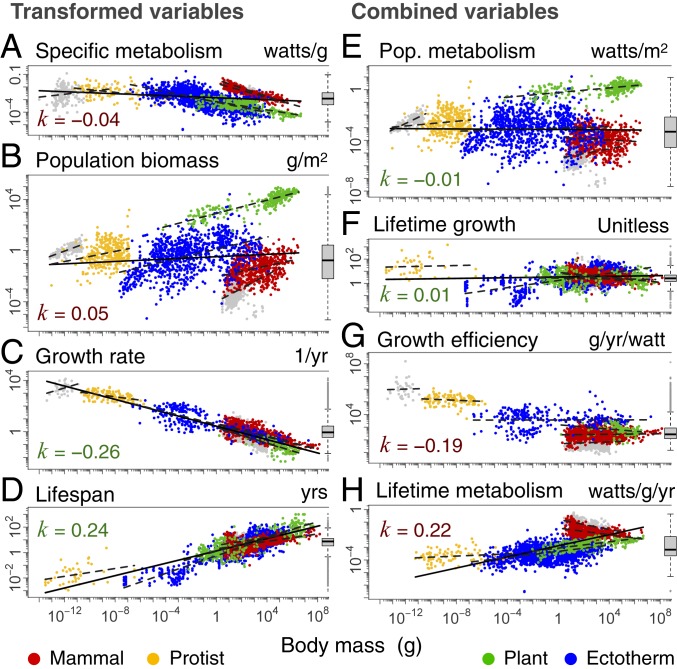
Fig. 2.
Scaling of transformed and combined variables with body mass. Data are the same as in Fig. 1 but transformed (A–D) and combined (E–H) as per Table 1, using taxonomic information down to the species level, where available. The dashed lines show within-group relationships, while the solid line shows the cross-group relationship. Colors of the exponent k correspond to colors of boxes in Table 1. The x- and y-axes have equal order of magnitude spacing. Boxplots are shown for each variable.

