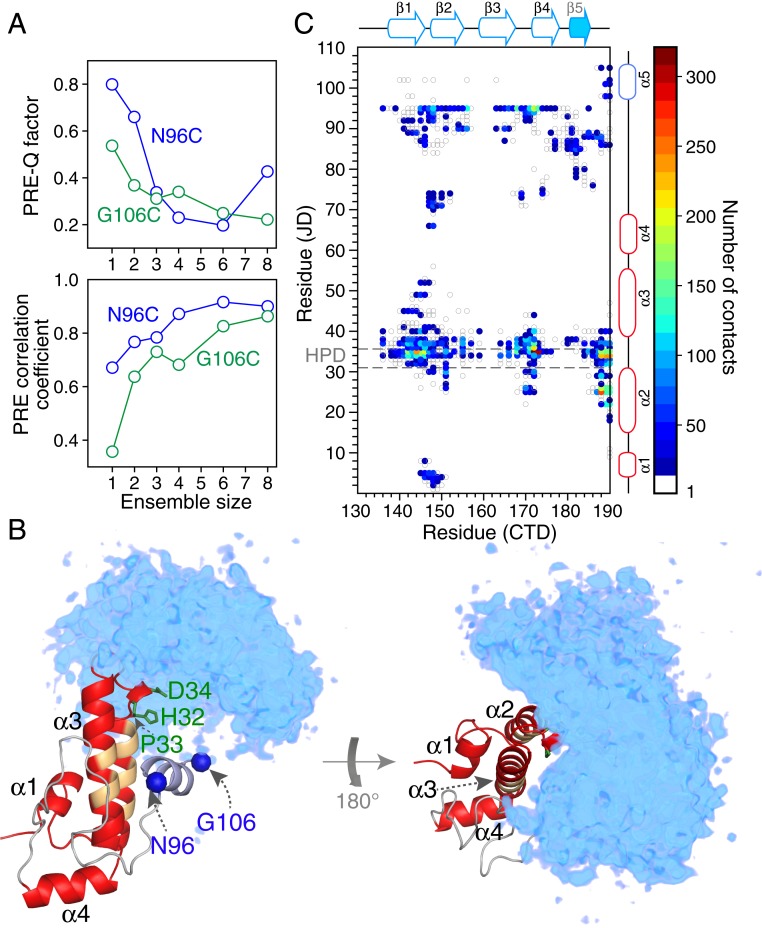
Fig. 6.
Analysis and visualization of the transient, sparsely populated closed state of ΔST-DNAJB6b from interdomain PRE data arising from nitroxide spin labels (R1) attached to surface engineered cysteine residues located at N96C and G106C. (A) Dependence of the Pearson correlation coefficient between observed and calculated PREs (Top) and PRE Q factor (Bottom); on ensemble size N. The agreement between observed and calculated PREs as a function of residue for the N = 6 ensemble calculations is displayed in Fig. 4. (B) Reweighted atomic probability density maps (50) of the CTD domain (cyan; shown at a contour level of 20%) with structures superimposed on the JD domain (red ribbon drawing), illustrating the conformational space sampled by the CTD domain relative to the JD domain. The nitroxide spin label attachment positions are shown as blue spheres, the side chains of the HPD motif are highlighted in green, and the backbone of residues previously identified to participate in the interface with Hsp70 (12) is indicated in orange. (C) Contact map showing transient interdomain contacts between the JD and CTD domains, calculated using the 10 lowest-energy ensembles (n = 6) and a cutoff of 8 Å. The HPD sequence motif is highlighted by the gray dashed lines. Details of the PRE-driven Xplor-NIH (36) simulated annealing calculations are provided in SI Appendix.

