Fig. 7.
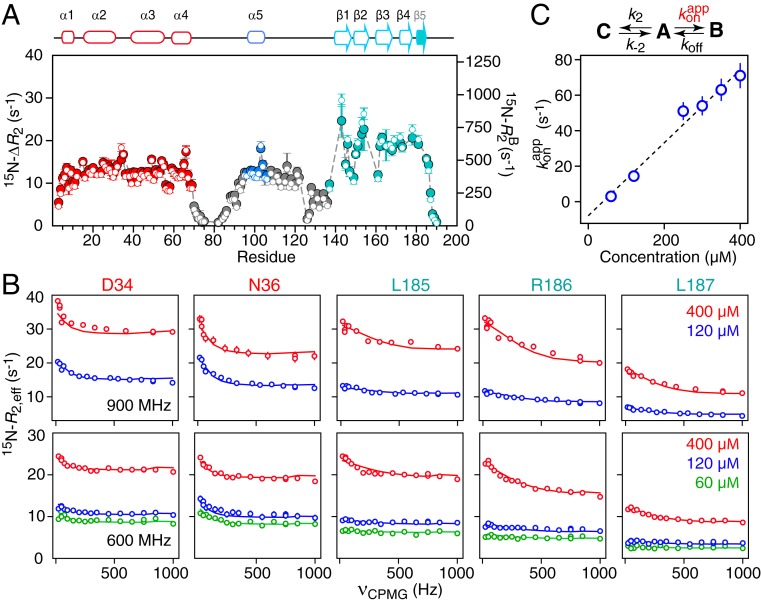
Quantitative analysis of 15N relaxation-based NMR data. (A) The 15N-ΔR2 profiles (filled in circles, y axis scale on the left) measured at 900 MHz as the difference in 15N-R2 rates between 400 and 60 μM samples of ΔST-DNAJB6b, together with the values of 15N- (open circles, y axis scale on the right) for the oligomer (state B) obtained from fitting all relaxation-based data (ΔR2, CPMG relaxation dispersion, and δex) to a branched 3-state model. The gray dashed lines are the calculated 15N-ΔR2 values obtained from the fit. (B) The 15N-CPMG relaxation dispersion profiles measured at 900 (Top) and 600 (Bottom) MHz at several different protein concentrations (as indicated in the figure). The experimental data are shown as open circles, and the best fits to the branching 3-state exchange model are shown as solid lines. (C) Linear concentration dependence of the pseudo–first-order association rate constant for the interconversion between the major open monomeric species (state A) and the oligomer-bound species (state B). (State C is the closed monomeric species.) The exchange-induced chemical shift data are shown in SI Appendix, Fig. S5. All experimental data were recorded at 25 °C.

