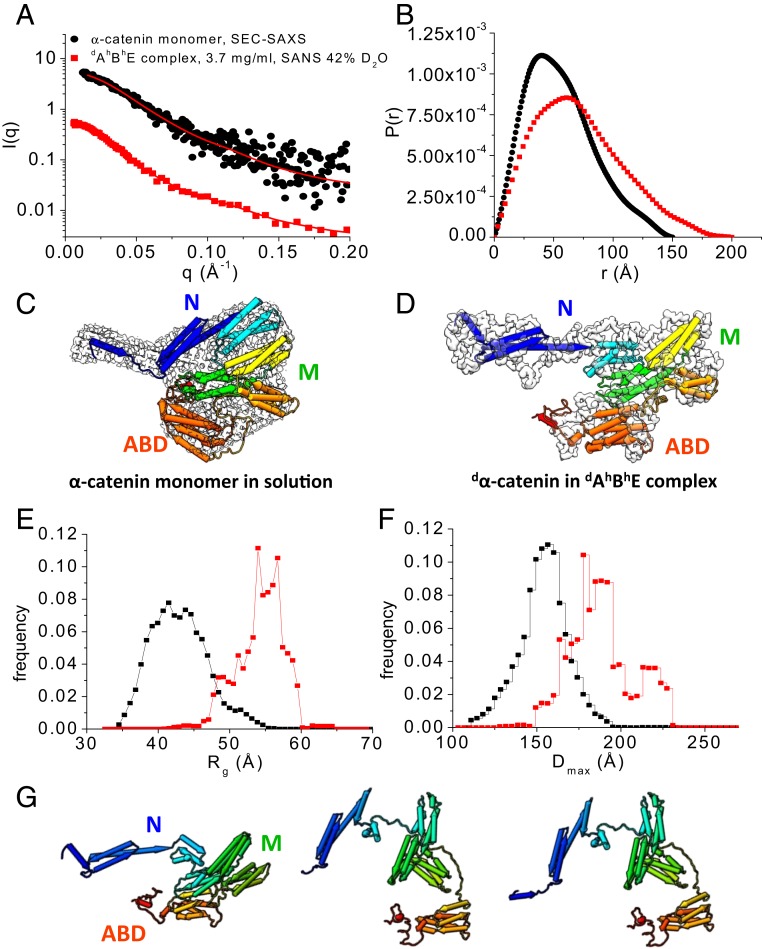
Fig. 3.
Conformation of α-catenin by itself and as part of the dAhBhE complex. (A) SEC-SAXS data of the α-catenin monomer alone in solution (black dots). Data are taken from ref. 38. SANS data of the dAhBhE complex, c = 3.7 mg/mL, in 42% D2O (red squares) at the contrast-matching point of hBhE, which only reveals the conformation of dα-catenin in the complex. Red lines are fits to the experimental scattering data for generating P(r). SI Appendix, Fig. S4 A and B shows Guinier plots and Kratky plots. (B) P(r) of the α-catenin monomer in solution (black) and of dα-catenin in the dAhBhE complex (red) generated from the scattering data in A. (C) The 3D shapes of the α-catenin monomer generated from SEC-SAXS data using the program DAMMIF/DAMMIN (73). (D) The 3D shape of dα-catenin within the dAhBhE complex generated from contrast-matching SANS data in 42% D2O using the program Gasbor (68). Docked into the 3D shapes are the α-catenin structures in solution and in the dAhBhE complex, which were generated by Monte Carlo simulations using the program SASSIE (43). (E and F) Rg distribution (E) and Dmax distribution (F) from EOM analysis (41, 42) of the SAXS and SANS data of the α-catenin monomer in solution (black) and of dα-catenin as a part of the dAhBhE complex (red). For the α-catenin monomer, Rflex = 75.3% (pool 84.5%) and Rσ = 0.68. For dα-catenin within the dAhBhE complex, Rflex = 72.9%, Pool 85.4%, and Rσ = 0.62. These values suggest that α-catenin is a flexible molecule. (G) Flexible structural models of dα-catenin in the dAhBhE complex obtained from Monte Carlo simulations show that the M domain and the ABD can adopt multiple configurations. The simulations were performed using the SANS data of dAhBhE in 42% D2O buffer as constraints. SI Appendix, Fig. S4 C and D shows quality of fit.

