Fig. 4.
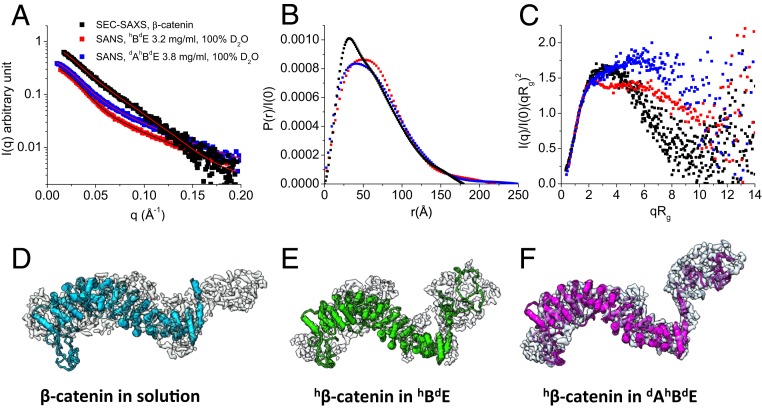
Conformation of β-catenin by itself and as part of the hBdE or dAhBdE complex. (A) SEC-SAXS data of β-catenin (black squares; reveal the conformation of β-catenin alone in solution) and contrast-matching SANS data of the hBdE complex in 100% D2O buffer (red squares; reveal the conformation of hβ-catenin in hBdE) and of the dAhBdE complex in 100% D2O buffer (blue squares; reveal the conformation of hβ-catenin in the dAhBdE complex). The lines are fits to the experimental data for generating the P(r) functions. SEC-SAXS profile of β-catenin in solution is shown in SI Appendix, Fig. S6. (B) P(r) of β-catenin in solution (black) and as part of the hBdE complex (red) or the dAhBdE complex (blue). (C) Dimensionless Kratky plots of the SAXS and SANS data shown in A. (D–F) The 3D molecular shape of β-catenin in solution from SEC-SAXS (D) and β-catenin in the hBdE complex from SANS in 100% D2O (E) and in the dAhBdE complex (F) from SANS in 100% D2O buffer. The 3D shapes were generated using the program Gasbor (68).

