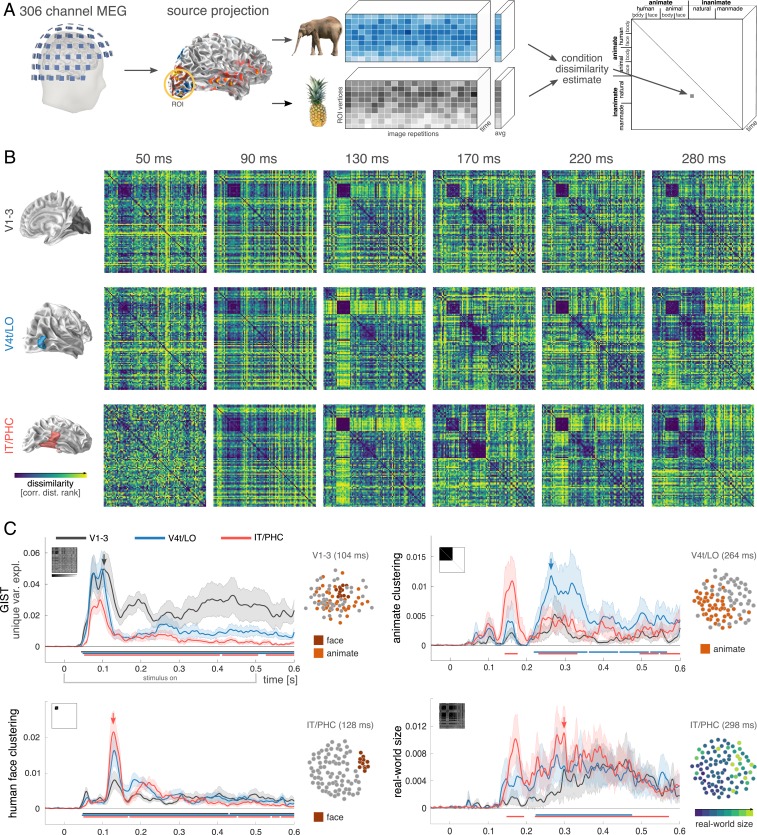
Fig. 1.
Representational dynamics analysis (RDA) reveals how feature selectivity emerges over time along distinct ventral-stream regions. (A) RDA pipeline to extract source-space RDM movies. (B) Participant-averaged RDMs (ranked) for regions V1–V3, V4t/LO, and IT/PHC at selected time points. All ROIs exhibit distinctive multistage representational trajectories. (C) Linear modeling of the temporal evolution of feature selectivity reveals a staggered emergence of representational distinctions within and across ventral-stream ROIs (black curve, V1–V3; blue, V4t/LO; red, IT/PHC). The horizontal bars indicate time points with effects significantly exceeding prestimulus baseline (nonparametric cluster-correction; cluster inclusion and significance level, P < 0.05). SE across participants shown as shaded area. Representational geometries at selected time points and ROIs are visualized in 2D using multidimensional scaling (MDS) to visualize effect magnitude.

