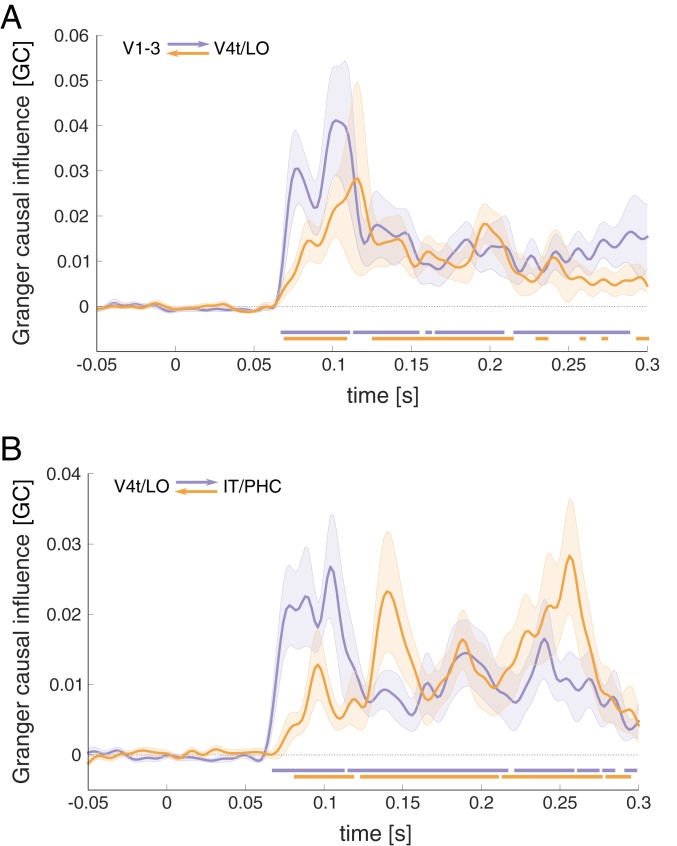
Fig. 2.
RSA Granger causality analysis was performed to estimate information flow between ventral-stream areas. (A) Feedforward (purple) and feedback (orange) direction of Granger causal influence between early and intermediate ROIs, and (B) effects between intermediate- and high-level ROIs. The horizontal bars indicate time points with causal interactions exceeding effects during prestimulus baseline (FDR corrected at q < 0.05). Data are shown baseline corrected.

