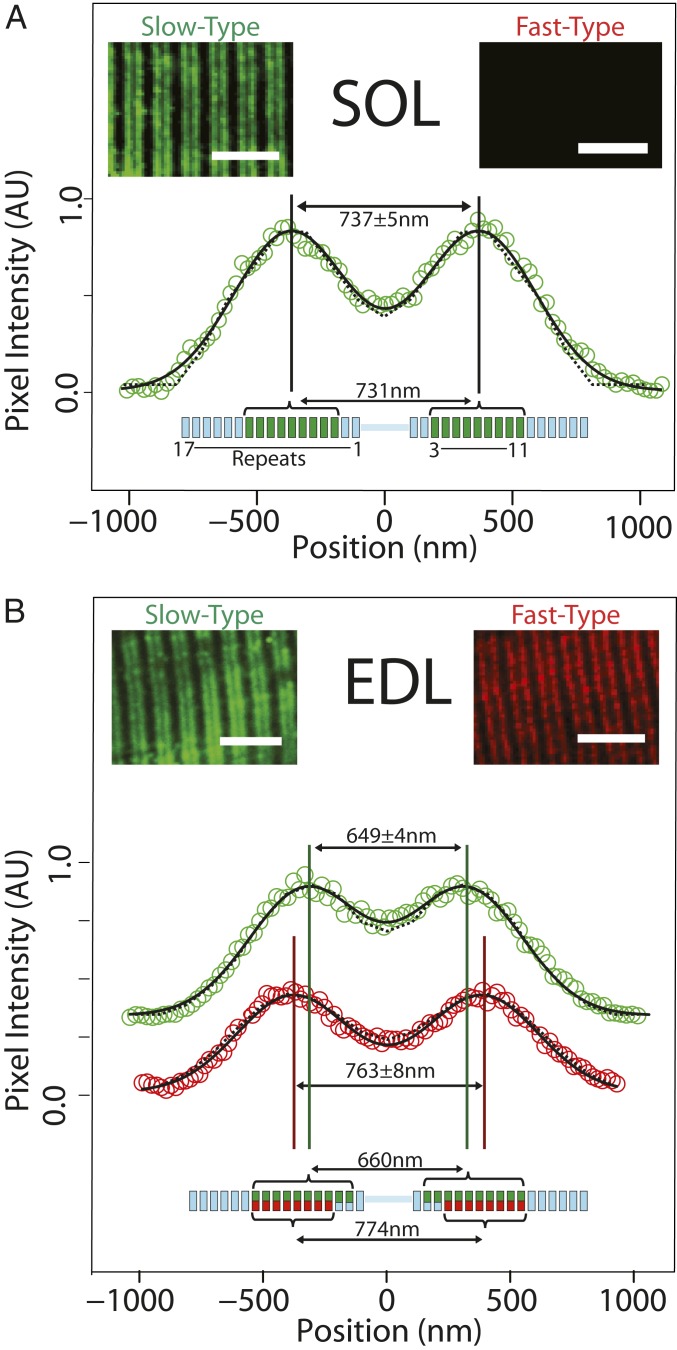
Fig. 2.
Immunofluorescence imaging and modeling of MyBP-C distribution in SOL and EDL muscle sections. (A) In slow-twitch SOL muscle, anti–slow-type MyBP-C antibodies label 2 bands in each sarcomere (Inset). The aligned and integrated intensity of these 2 bands (open circles) (SI Appendix, Materials and Methods) are well fit with two Gaussian peaks (solid line) with a separation of 737 ± 5 nm. Analytical modeling (dotted line) (SI Appendix, Materials and Methods) demonstrated that, if slow-type MyBP-C is distributed across thick filament repeats 3 to 11 (green bars in thick filament schematic below), the anticipated peak-to-peak separation would be 731 nm, coincident with the immunofluorescence data. Fast-type MyBP-C was not detected in SOL muscle (Inset). (B) For fast-twitch EDL muscle, doublet bands were apparent upon labeling with either slow-type or fast-type MyBP-C antibodies (Insets). Intriguingly, the separation distance of the two fitted Gaussian peaks differed for slow-type and fast-type MyBP-C. The spatial distribution for slow-type MyBP-C (649 ± 4 nm peak-to-peak separation, green) is closer toward the sarcomere midline than fast-type MyBP-C (763 ± 8 nm separation, red). Our model suggests that slow-type and fast-type MyBP-C cooccupy repeats 4 to 11 (green and red bars, respectively, in thick filament schematic below data); slow-type MyBP-C may also occupy repeats 2 and 3, although at reduced occupancy (i.e., 2 of 3 possible MyBP-C molecules per repeat, indicated with partial green bars in the thick filament schematic). This occupancy pattern would result in 660 nm peak-to-peak spacing for slow-type MyBP-C and 774 nm for fast-type MyBP-C. (Scale bars: 5.0 μm in all images.)

