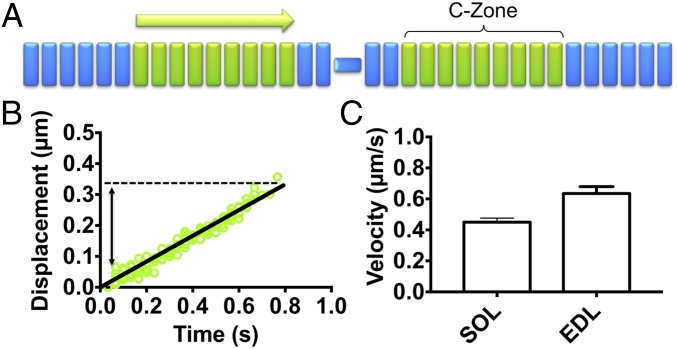
Fig. 4.
Native thin filament motility at pCa 7.5 over native thick filaments from SOL and EDL muscles. (A) Illustration of native thin filament trajectories observed over native thick filaments, which, as in B, are described by a constant velocity (light green arrow) that corresponds to the length of the C-zone. (B) Representative SOL thin filament displacement vs. time trajectories that persist for ∼350 nm. (C) The velocities of the SOL and EDL thin filament trajectories are comparable to the slow velocity phase of the dual-phase trajectories at pCa 5 (Fig. 3D). All data are presented as mean ± SEM. Data are summarized in Table 3.

