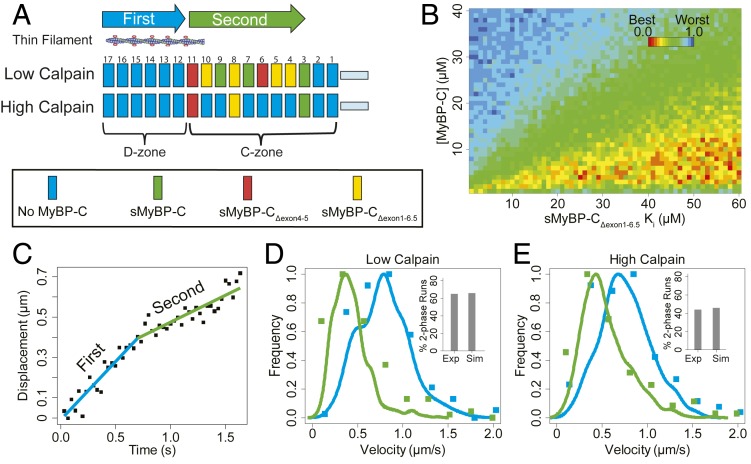
Fig. 6.
In silico modeling showing the slowing effects on thin filament motility at pCa 5 of the slow-type MyBP-C isoform complement in the C-zones of native SOL thick filaments. In addition, the model was used to extrapolate the functional influence of sMyBP-CΔexon1-6.5, which could not be characterized by in vitro motility (see main text and SI Appendix for model details). (A) Schematic illustrating the localization of slow-type MyBP-C molecules in repeats 3 to 11 within the C-zone of native thick filaments. The probability that a repeat is occupied by a specific MyBP-C isoform is related to the relative abundance for the isoform as determined by LCMS (Table 2). At low calpain treatment, slow-type MyBP-C N termini remain intact while high calpain treatment cleaves 64% of the N termini (Table 2), thereby reducing the intact MyBP-C repeat occupancy down to ∼3 repeats within the C-zone. (B) The model has two variable parameters: the effective total MyBP-C concentration and the Ki (inhibition constant) for the sMyBP-CΔexon1-6.5 isoform. The heat map shows the normalized goodness of fit for a range of modeled parameters that are used to generate model thin filament trajectories, as compared to the experimental data from Fig. 3 and Table 3. There is no unique best fit parameter set, but rather a range of best fit parameters for the effective total slow-type MyBP-C concentration of 3 to 12 µM. More importantly, the predicted Ki being >25 µM for the sMyBP-CΔexon1-6.5 isoform, which is well above the effective total MyBP-C concentration, suggests this isoform has little to no inhibitory effect on thin filament slowing. (C) Displacement vs. time trajectories generated by the model, showing the dual velocity phases. (D) Velocity distributions for the individual phases of the dual velocity phase trajectories (fast velocity phase, blue; slow velocity phase, green) for the simulated data (solid lines) compared to the experimental data (solid symbols), with the percentage of dual phase runs for the experimental (Exp) and simulated (Sim) data in the Insets. (E) As in D, but after high calpain treatment. All plots demonstrate that the simulated data generated using the modeled best fit values (4 µM total [MyBP-C], 26 µM Ki for MyBP-CΔexon1-6.5) closely resemble experimental native thick filament data.

