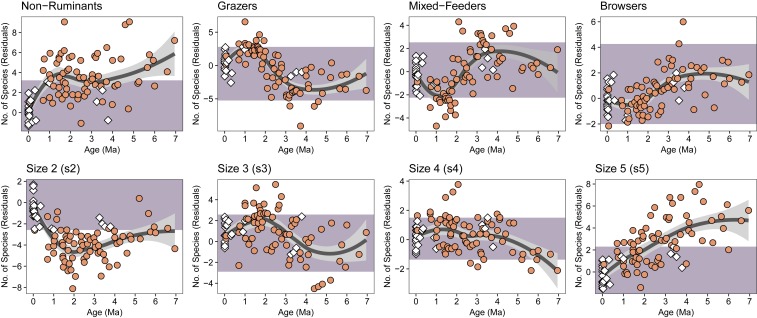
Fig. 2.
Temporal trends in the functional trait composition of eastern African large herbivore communities over the last 7 Myr. Purple shading represents the modern range of variation for each trait. White diamonds indicate fossil communities that fall within the modern range of variation for all 8 functional traits. Orange circles indicate fossil communities that are non-analog; they fall outside the modern range of variation for one or more of the functional traits illustrated here. Dark gray lines represent LOESS regressions with a smoothing factor of 0.75; 95% confidence limits in light gray (see SI Appendix for further information).

