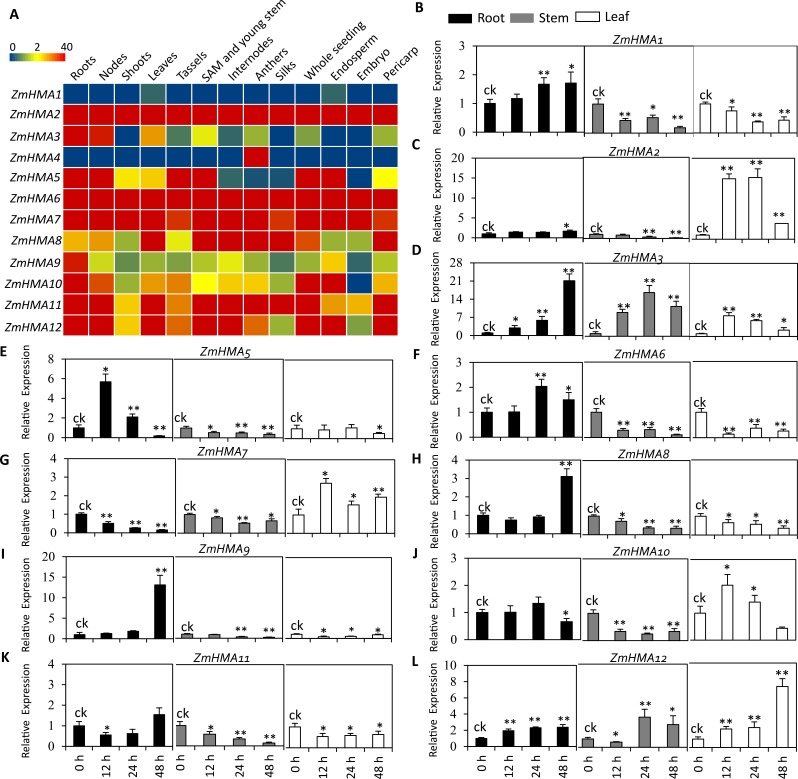
Figure 3. Expression profiles of eleven ZmHMA genes in maize.
(A) A heat map illustrating levels of gene expression of the 12 ZmHMAs in 13 different tissues from various developmental stages. FPKM values were shown in different colors representing expression levels as indicated by the scale bar. (B–L) Relative expression levels of 11 ZmHMAs in maize B73 root, leaf and stem tissues grown hydroponically under normal (ck) and Cd-additive conditions (200 µM) at the vegetative growth stage for 12 h, 24 h and 48 h. The comparisons of gene expression under ck and Cd stress conditions were performed using a two-sided t-test: * p ≤ 0.05, ** p ≤ 0.01. Bars indicate standard deviation.

