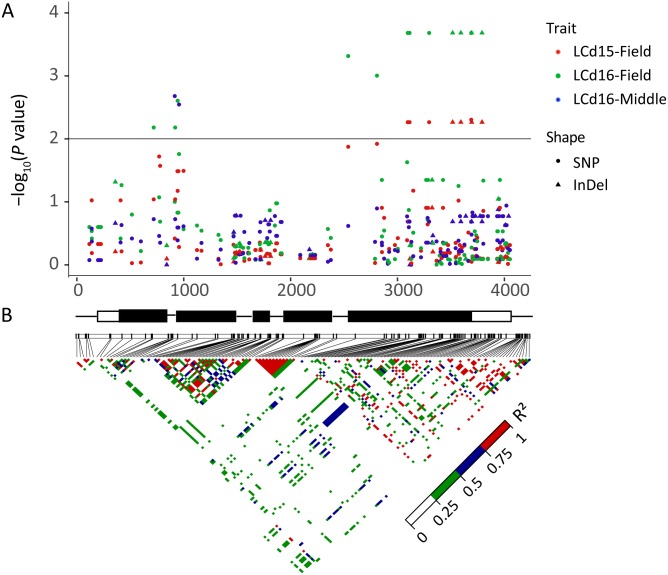
Figure 5. Natural variation within ZmHMA3 was associated with Cd concentration in leaves.
(A) Natural variation in ZmHMA3 associated with Cd concentration in leaves under different Cd conditions at seeding stage and mature stage. The P value is shown on a –log10 scale. SNP represent single nucleotide polymorphism. InDel represent insertion or deletion. A schematic diagram of the entire gene structure is presented as the x-axis, including white and black boxes showing as UTRs and exons, respectively. (B) The pattern of pair wise linkage disequilibrium (LD) of DNA polymorphisms (MAF > 0.05) in decay of ZmHMA3. The level of LD (r2) values is indicated with color key.

