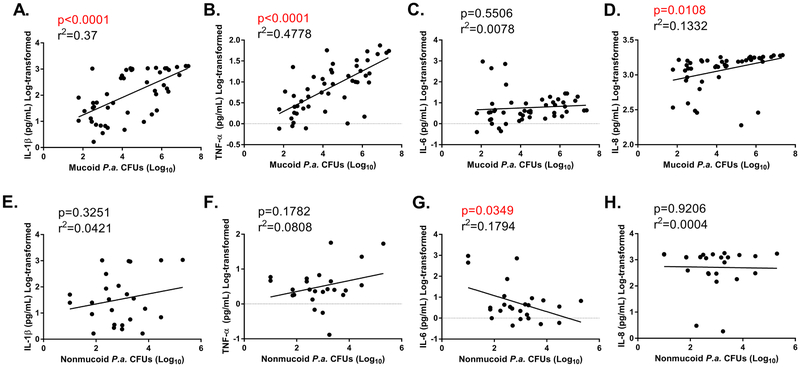
Fig. 4. Infection with mucoid P. aeruginosa directly correlates with higher proinflammatory cytokine concentrations within regional BAL specimens.
Proinflammatory cytokine concentrations were measured in regional BAL specimens from all CF patients (n=14 patients= 84 lobar BALs) via V-PLEX array. Cytokine concentrations are plotted versus mucoid P. aeruginosa CFUs/mL (A.-D.) or nonmucoid P. aeruginosa CFUs/mL (E.-H.) for each patient specimen. Correlation plots for A./E. IL-1β (pg/mL), B./F. TNF-α (pg/mL), C./G. IL-6 (pg/mL), D./H. IL-8 (pg/mL). R2 and slope p-values are shown. Statistically significant correlations (p<0.05) are highlighted in red text.

