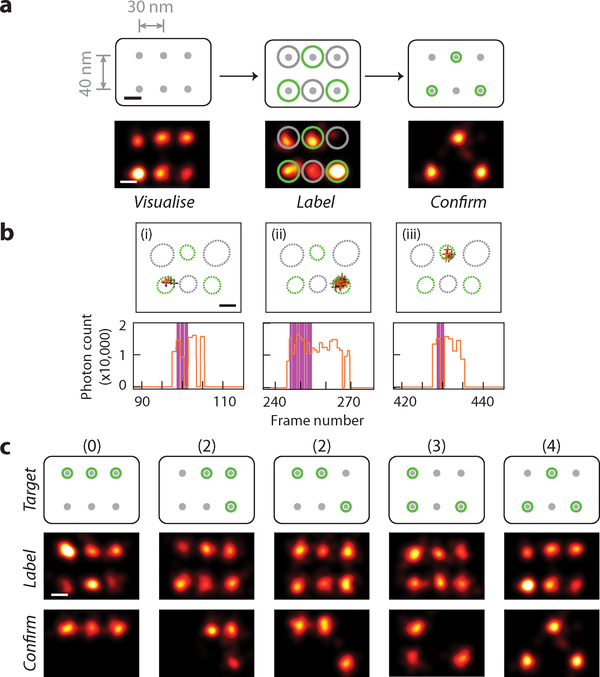
Fig. 3. Multi-point super-resolution patterning.
(a) Schematics and representative images at different stages of targeted 3-point single-molecule labelling experiment. Top row, schematics of DNA test structure design with 6 candidate targets, spaced 30–40 nm apart, bottom row, super-resolution images. Within bottom row, left panel shows pre-acquisition image of candidate target sites, middle panel shows real-time labelling session image of CNVK labelling strand transient blinking events, and right panel shows post-acquisition image of labelled targets.
(b) Example of real-time blinking and laser activation traces, comprising of three blinking events on different targets and three laser pulses for the sample in (a). For each detected blinking event, XY traces (top) and time traces (bottom) are shown.
(c) Representative examples of successful 3-point patterning experiments for each visually distinct pattern. Top row, schematics of different 6-choose-3 labelling patterns, arranged by increasing difficulty (number of 30-nm-spaced pairs necessary to be correctly distinguished for successful patterning), labelled on top, middle row, pre-acquisition images; bottom row, post-acquisition images. Last column shows the same experiment as in (a).
In (a,c), grey dots without and with green halo indicate idle and labelled targets, black crosses indicate fixed position markers; green and grey circles overlaid on super-resolution images indicate desired and undesired target sites, respectively.
In (b), XY traces are colour-coded by time (from black to orange) and overlaid with include- (green, dotted circle) and exclude- (grey, dotted circle) ROIs; time traces show detected photon count per single-molecule localisation (orange), overlaid with crosslinking laser illumination events (magenta).
See Supplementary Fig. 10–11 for more representative examples of both successful and unsuccessful 3-point labelling experiments, and Supplementary Notes 3.4 for discussion regarding statistics and reproducibility.
All scale bars, 20 nm.

