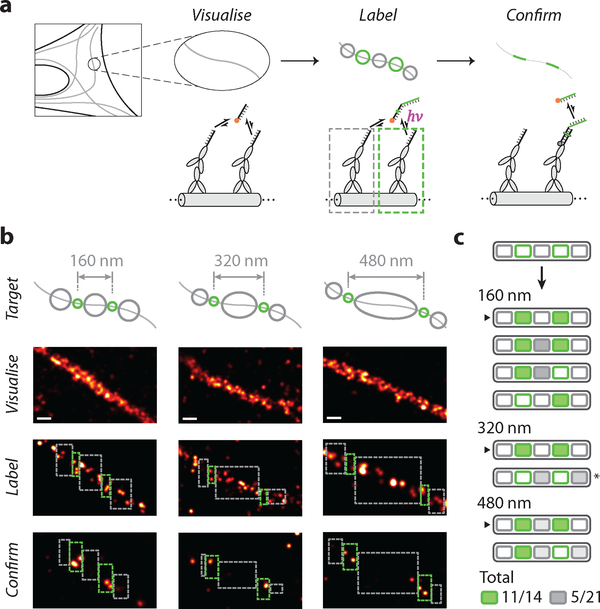
Fig. 4. In situ super-resolution labelling on microtubules.
(a) Schematics and workflow of super-resolution labelling on immunostained and DNA-labelled microtubule samples, in fixed BSC-1 cells. Colour schemes and legends are same as in Fig. 1.
(b) Examples of successful 2-target patterning on microtubules for different inter-target spacing. Top row, schematics of desired labelling patterns; second row, pre-acquisition images; third row, real-time labelling session images; bottom row, post-acquisition images.
(c) Schematic list of the outcome of 8 experimental trials. Successfully labelled targets are shaded green, and undesired labels in exclude areas are shaded different grey levels to reflect the difference in exclude area. Arrows indicate experiments shown in (b). (*) indicates the experiment excluded from statistics, due to likely sample movement based on a visual observation of an apparent change in microtubule morphology between pre- and post-acquisition sessions.
In all panels, green and grey circles in schematics indicate desired and undesired targets; green and grey dashed rectangles indicate experimental include- and exclude-ROIs, respectively. ROIs in last row (post-acquisition images) are adjusted by 20 nm edge buffer, according to the overall localisation and labelling precision.
See Supplementary Fig. 13 for more examples of microtubule labelling experiments and Supplementary Fig. 14 for more details on labelling efficiency and specificity. See Supplementary Methods and Notes 3.3 for more details regarding crosslinking efficiency and specificity calculation, and edge-buffered ROIs, and Supplementary Notes 3.4 for discussion regarding statistics and reproducibility.
Scale bars in (b), 100 nm.

