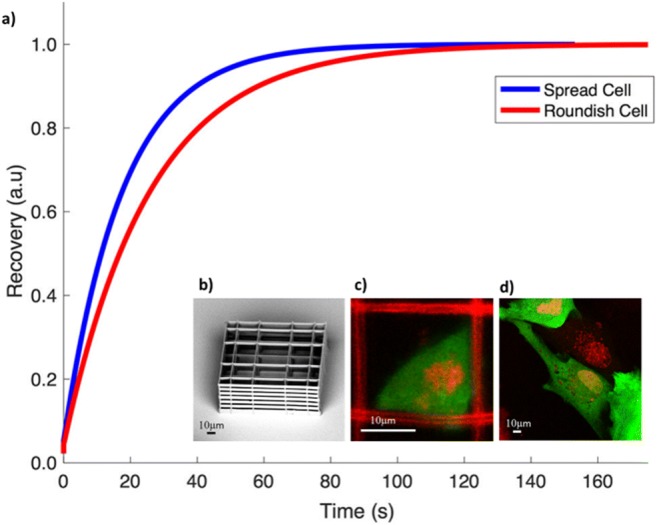
Fig. 6.

GFP fluorescence recovery after photo-bleaching curves measured on spread cells adhered on a flat substrate or roundish cells adhered in a Nichoid. (b) SEM image of a Nichoid. (c) Examples of GFP-expressing MSCs (green) grown into the Nichoid. In red, the Nichoid fluorescence and the cell DNA are visible. (d) Examples of GFP-expressing MSCs (green) grown on flat glass substrate. In red, the cell nuclei are highlighted
