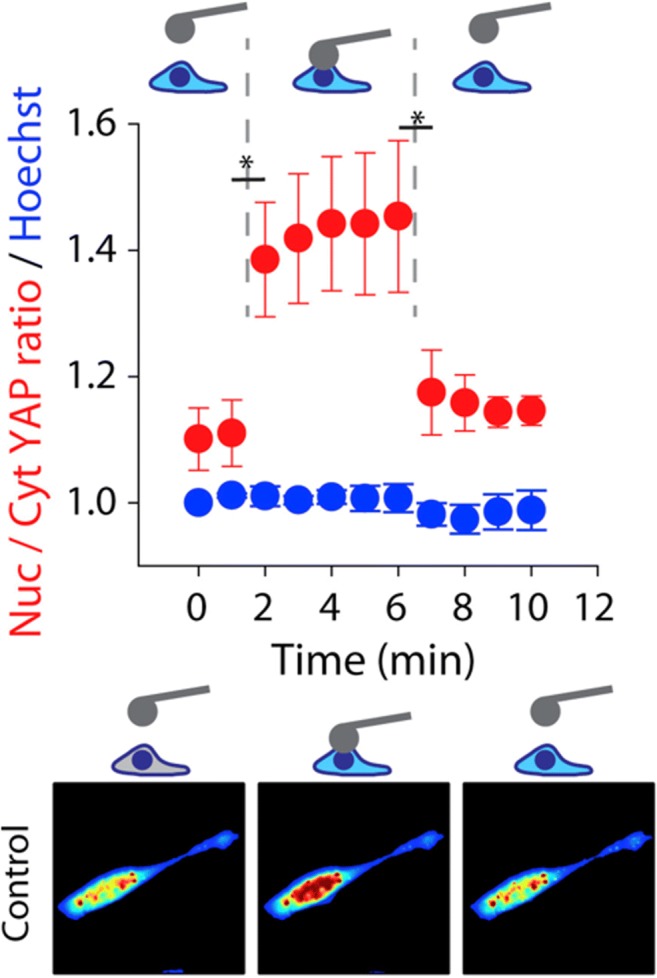
Fig. 7.

Top: Nuclear/cytosolic YAP ratio (red) and Hoechst nuclear average intensity (blue) for fibroblast cells seeded on 5 kPa gels (n = 9 cells) and transfected with EGFP-YAP during AFM indentation. Force was applied with an AFM cantilever with a 20-mm-diameter spherical tip. Sequentially: No force (1 min), 1.5 nN force (5 min), and no force (4 min). Bottom: Examples of color maps showing YAP fluorescence intensity in the conditions measured. Image taken from (Elosegui-Artola 2018) with permission
