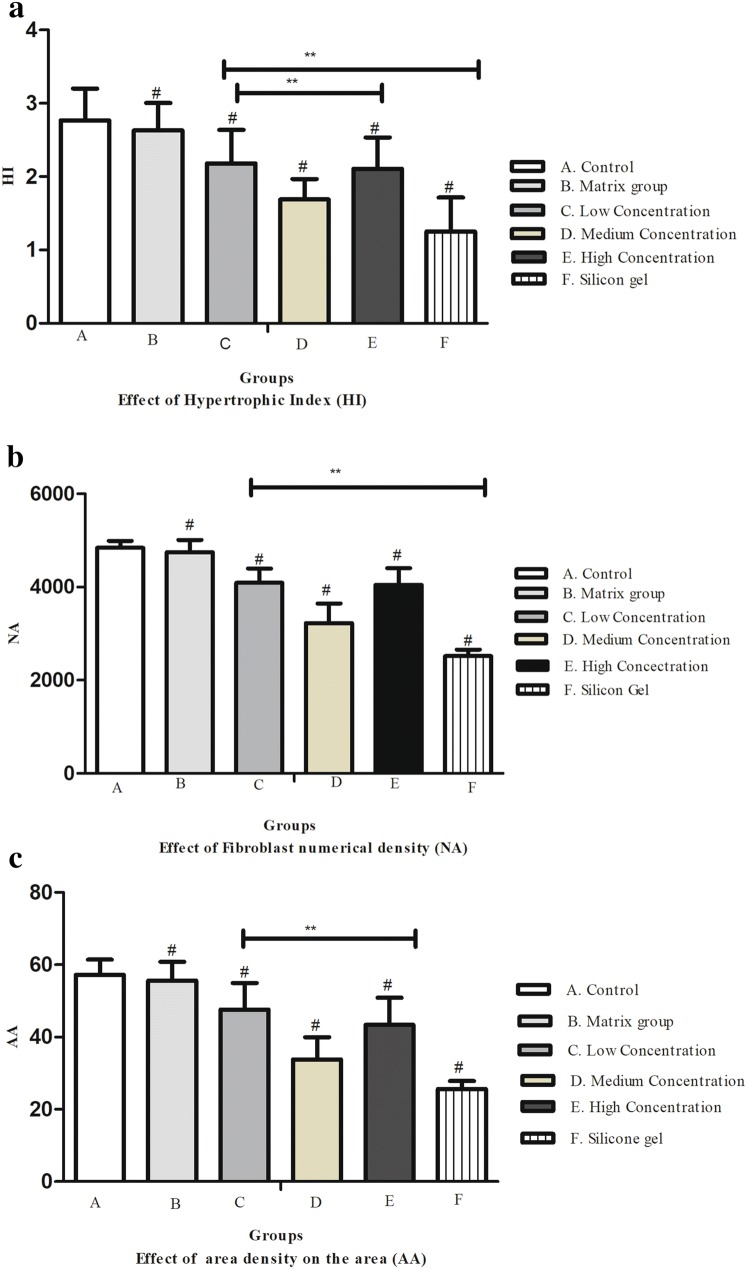
Fig. 5.
a Hypertrophic Index (HI) on rabbit's ear scar samples. In (A) control group, (B) matrix group, (C) low-concentration ART cream, (D) medium-concentration ART cream, (E) high-concentration ART cream, and (F) silicone gel group. Error bars represent SD. A column represents mean ± SD, n = 4 **P < 0.01 compared with artesunate treatment group and silicone gel group, #P < 0.05 compared with the control group. b Fibroblast number density (NA) on the hypertrophic scar on the rabbit's ear. (A) Control group, (B) matrix group, (C) low-concentration ART cream, (D) medium-concentration ART cream, (E) high-concentration ART cream, and (F) Silicone gel group. Error bars represent SD. A column represents mean ± SD, n = 4 **P < 0.01 compared with ART treatment group and silicone gel group, #P < 0.01 compared with the control group. c Surface area of collagen fibers (AA) on the hypertrophic scar on the rabbit's ear. (A) Control group, (B) matrix group, (C) low-concentration ART cream, (D) medium-concentration ART cream, (E) high-concentration ART cream, and (F) silicone gel group. Error bars represent SD. A column represents mean ± SD, n = 4 **P < 0.01 compared with A&M treatment group, #P < 0.01 compared with control group

