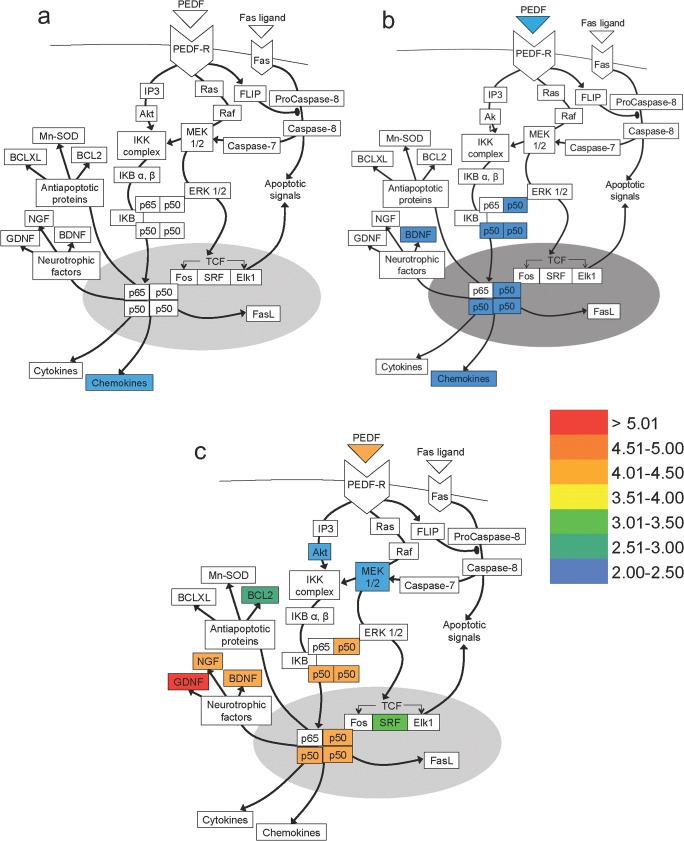
Fig. 1.
Microarray data showing changes in mRNA of molecules of the PEDF pathway in non-regenerating and regenerating DRGN models. Fold difference in mRNA extracted from DRG 10 days post-lesion after a DC, b SN, and c pSN + DC models. Fold increase in mRNA was normalised to the intact controls. Curved line indicates cell membrane. Grey oval indicates nucleus. Arrows indicate promoting interaction. Arrows with oval tips indicate inhibitory interactions. Colour chart indicates fold-increase by colour heat with indicated levels of gene expression (fold-changes compared with the intact controls)

