
Fig. 1.
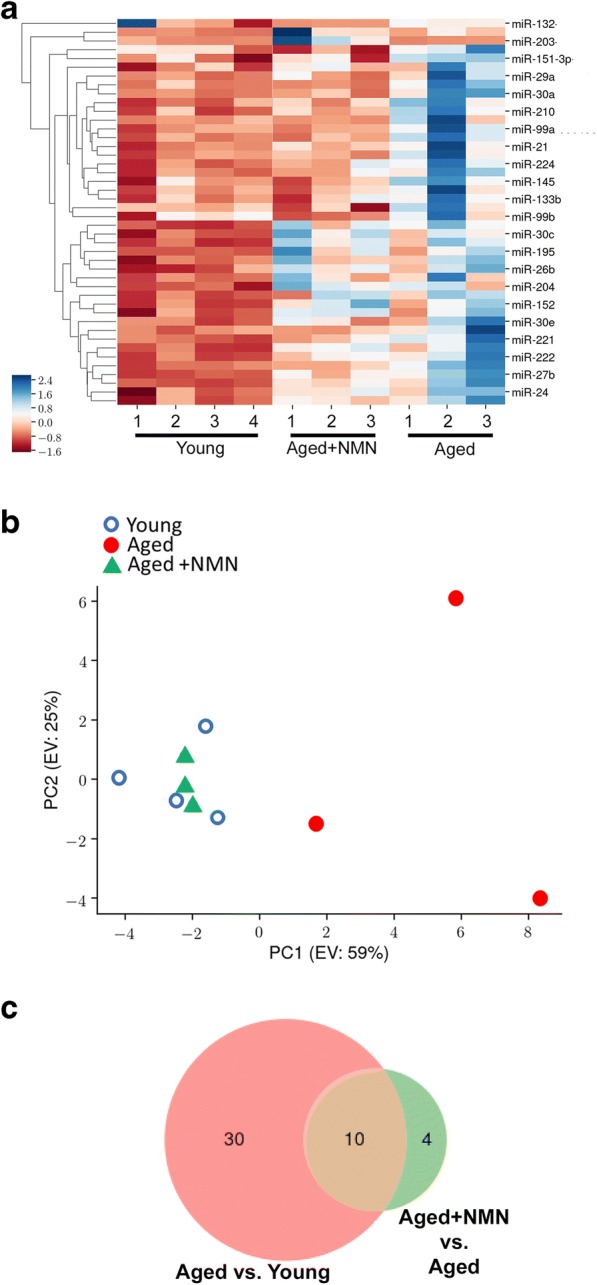
NMN treatment reverses age-related changes in miRNA expression profile in the mouse aorta. a The heat map is a graphic representation of normalized miRNA expression values in aortas derived from young (3-month-old), aged (24-month-old), and NMN-treated aged mice. Hierarchical clustering analysis revealed the similarities on miRNA expression profiles of aortas from young and NMN-treated aged mice. b Principal component analysis (PCA) plot of miRNA expression profiles from aortas derived from young, aged control, and NMN-treated aged mice. The profiles from aged mice (red dots) cluster separately to clusters representative of young mice (blue circles) and NMN-treated aged mice (green triangles). PC1 and PC2: Principal components 1 and 2, respectively. c Venn diagrams showing the differentially expressed miRNAs in each group, which are significantly up- or down-regulated in aortas from aged mice compared to those from young mice or aged NMN-treated mice