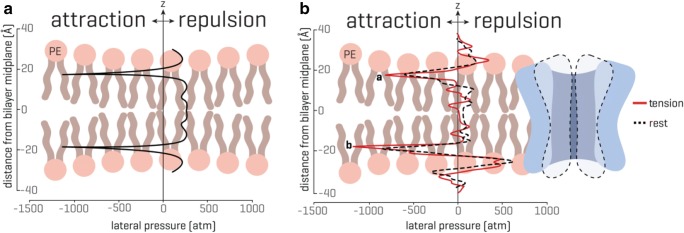
Fig. 3.
Transbilayer pressure profile. The transbilayer pressure profile is largely inhomogeneous across the bilayer thickness, which originates from the amphipathic nature of the lipid molecules and the presence of water. (A) An idealized symmetrical lipid bilayer. The transbilayer pressure profile shows characteristic negative peaks at the water-lipid interface (~ 1000 atm) and repulsive positive peaks (~ 300 atm) in the headgroup and tail region. The z indicates the bilayer thickness direction. (B) In the presence of a membrane protein, the pressure profile in a symmetrical lipid bilayer becomes noticeably asymmetric. Peak a and peak b represent the rise in the pressure profile at the lipid solvent interface (modified from Cox et al. 2016b; for more details see also Bavi et al. 2016)

