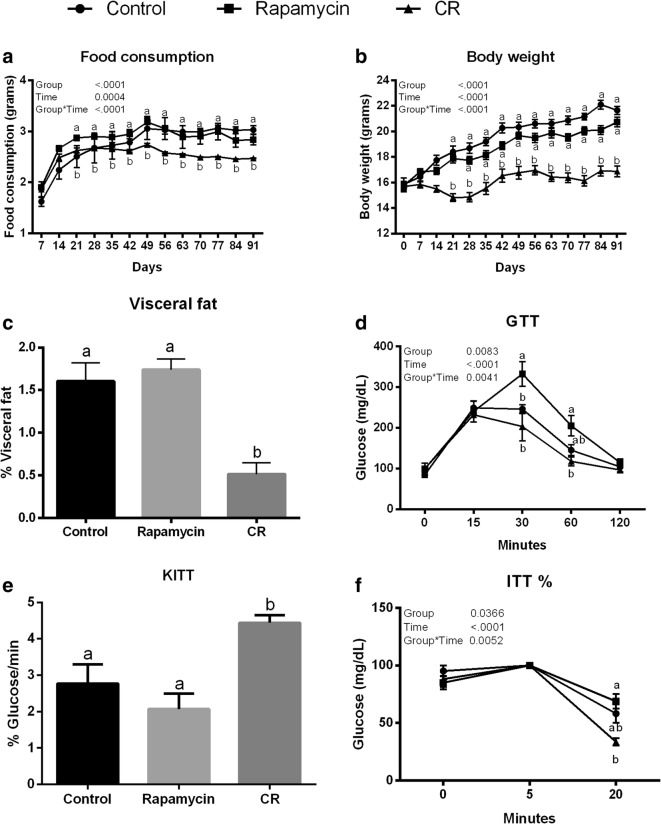
Fig. 2.
Analysis of food consumption (a), body weight (b), visceral fat (c), glucose tolerance test (GTT) (d), constant rate for glucose disappearance (KITT) (e), and insulin tolerance test (ITT) (f) for caloric restriction (CR), rapamycin, and control groups. Different letters indicate difference between groups (P < 0.05). Values were plotted as mean ± standard error of the mean. Twelve mice/group were used for this analysis

