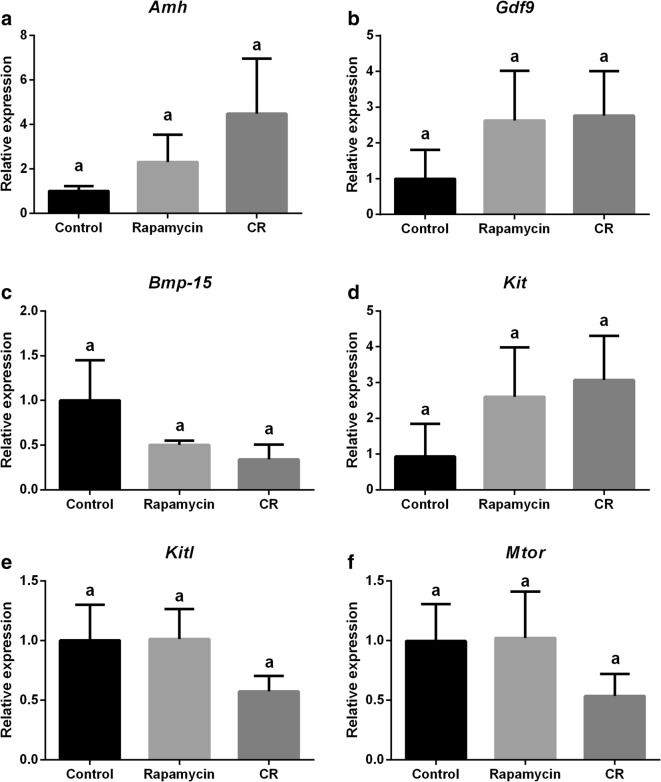
Fig. 4.
Analysis of the relative gene expression of ovarian genes of control, rapamycin, and caloric restriction (CR) mice. a Anti-mullerian hormone (Amh). b Growth factor and differentiation 9 (Gdf9). c Bone morphogenic protein 15 (Bmp-15). d Proto-oncogene receptor tyrosine kinase (Kit). e Kit Ligand (Kitl). f Mammalian target of Rapamycin (Mtor). Different letters indicate difference between groups (P < 0.05). Values were plotted as mean ± standard error of the mean. Six mice/group were used for this analysis

