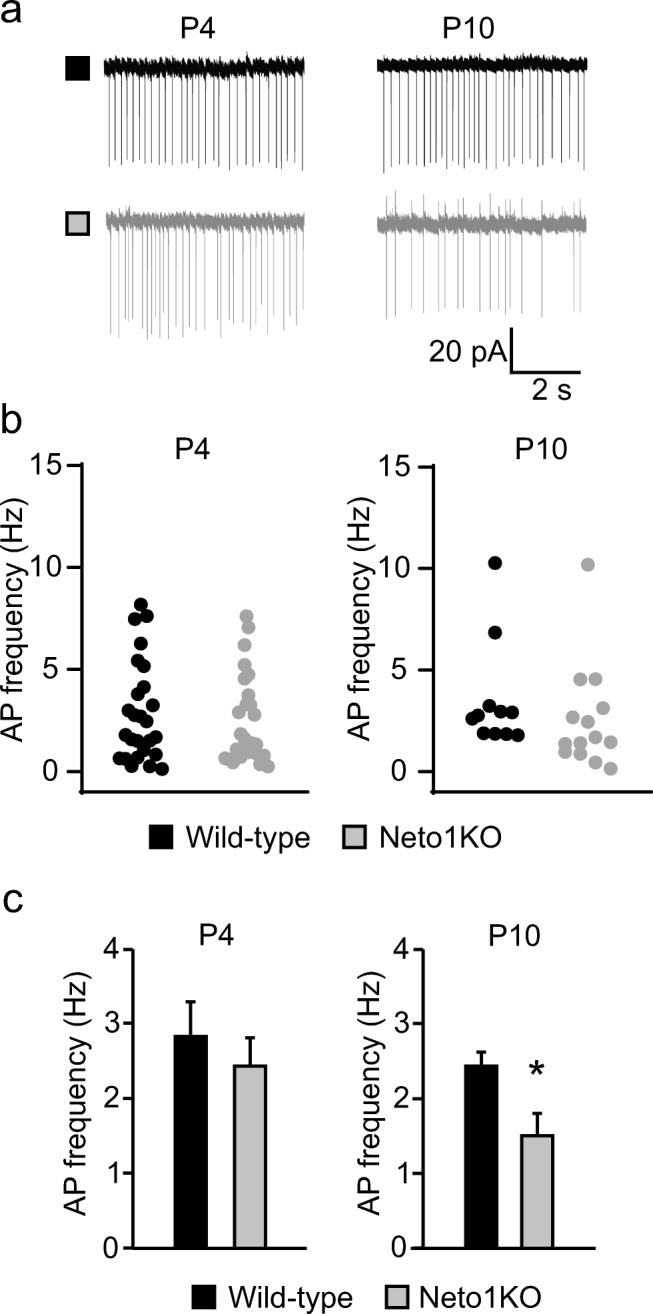
Fig. 6.

Spontaneous action potential firing of CA3 stratum radiatum interneurons in WT and Neto1KO slices. a Example traces of cell-attached recordings illustrating spontaneous action potential firing of CA3 stratum radiatum interneurons of WT (black) and Neto1KO (gray) slices at P4 and P10. b Graphs showing the mean action potential firing frequency of individual CA3 stratum radiatum interneurons at P3–6 (n = 18, n = 17) and P9–10 (n = 12, n = 14) in WT and Neto1KO slices, respectively. c Pooled data of mean action potential firing frequency of CA3 stratum radiatum interneurons at P3–6 (n = 18, n = 17) and P9–10 (n = 9, n = 11) from WT and Neto1KO, respectively. Cells with high firing frequency are excluded from the P9-10 age group. *p < 0.05; **p < 0.01; ***p < 0.001
