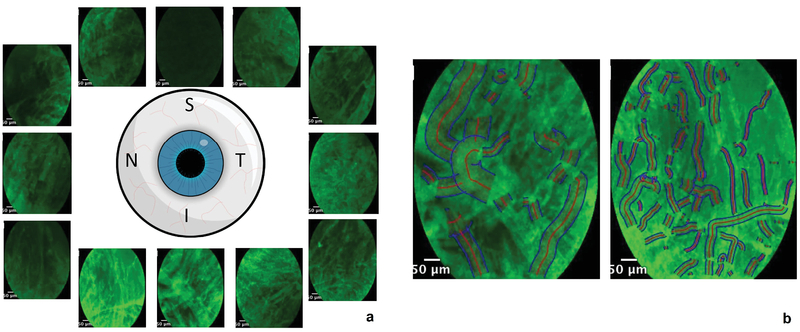
Figure 5.

Distribution of fluorescence signal along the limbal perimeter. Representative frames from individual quadrants were chosen to highlight the differences in fluorescence signals along the limbus (a). The differences can be quantified using a vessel segmentation algorithm, which automatically detects the vessel border and midline (b) and quantifies vessel diameter and signal intensity in the chosen region of interest.
