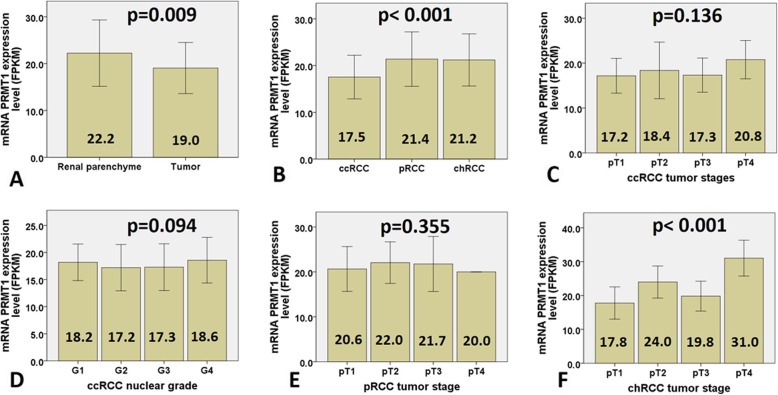
Fig. 5.
mRNA PRMT1 transcript profiling data (FPKM values) for TCGA cohorts relative to tumor tissue and tumor stage. a mRNA PRMT1 expression level was decreased in tumor tissue related to non-tumor parenchyma; (b) In tumor tissue, mRNA PRMT1 expression level was significantly lower in ccRCC, when compared to pRCC and chRCC; (c-d) However, mRNA PRMT1 expression level in ccRCC was not associated with tumor stage, neither with nuclear grade; (e) Likewise, mRNA PRMT1 expression level in pRCC was not associated with tumor stage; (f) On the other hand, mRNA PRMT1 expression increase was observed in stage IV of chRCC; mRNA expression levels are presented with Fragments Per Kilobase Million values (FPKM) (+/− 1 SD). Statistically significant difference p < 0.05

