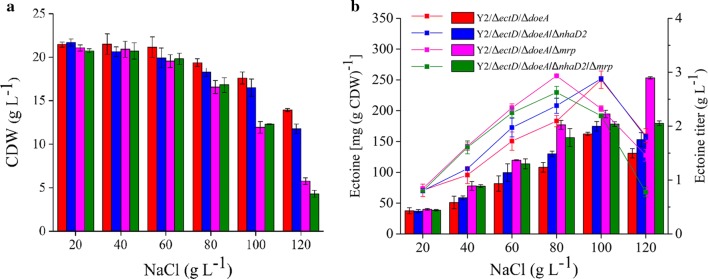
Fig. 3.
Growth (a) and ectoine production (b) of H. hydrothermalis Y2 and its mutants in various NaCl concentrations. Lines represent total ectoine titer (g L−1) and columns represent total ectoine specific production [mg (g CDW)−1]. The strains were cultured in 500-mL flask containing various NaCl at pH 9.0. Each experiment was conducted in triplicate

