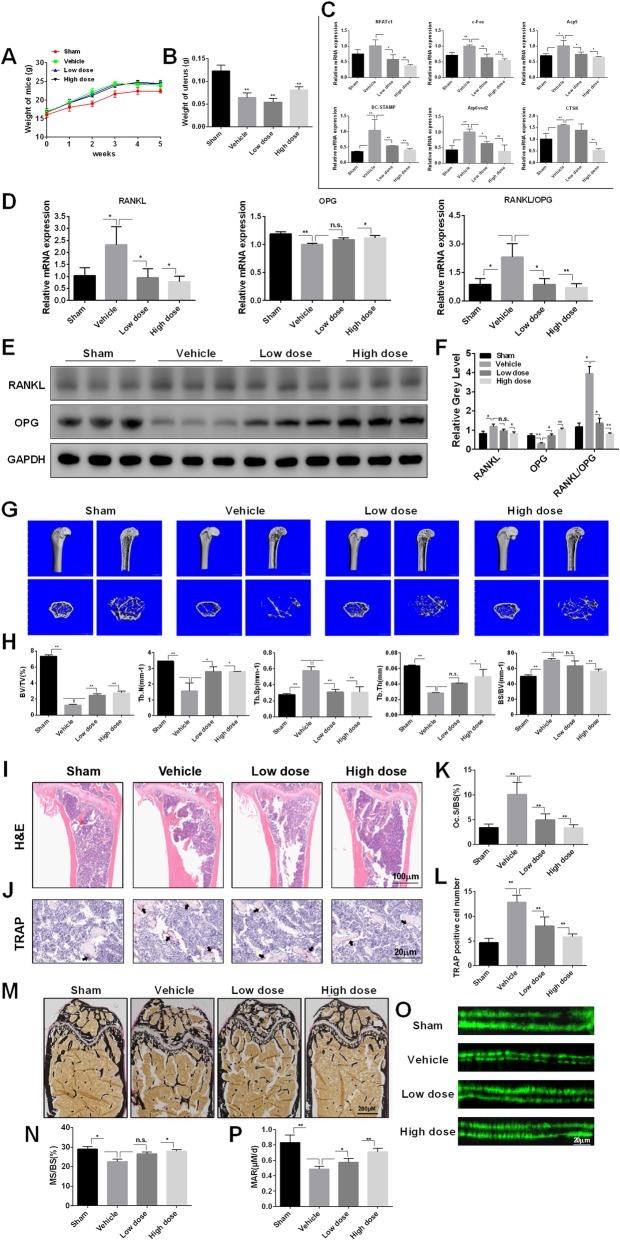
Fig. 10.
T007 prevention of OVX-induced bone loss in vivo. Verify whether the osteoporosis mouse model induced by OVX was successfully constructed through measuring mouse body weight (a) and uterine weight (b). c The expression levels of NFATc1, c-Fos, DC-STAMP, Acp5, Atp6vod2, CTSK were examined using qRT-PCR. The mRNA and protein expression levels of RANKL, OPG, and RANKL/OPG were detected using RT-qPCR (d) and western blotting (e, f), respectively. g The femur of each mouse were scanned with micro-CT. h The BV/TV, BS/BV, Tb. Sp, Tb. T and Tb. N of each sample was measured. Sections of femur were stained with H&E (i) and TRAP (j) staining. k, l The OcS/BS and number of osteoclasts per field of each sample was analyzed. m, n Sections of femurs were stained with von Kossa, and calculated the MS/BS (%). o, p Calcein double fluorescent labeling to observe the mouse femur MAR. All experiments were performed at least three times. *P < 0.05 and **P < 0.01 compared with the control group. BV/TV: bone volume per tissue volume, BS/BV: bone surface per bone volume, Tb.Sp: trabecular separation, Tb.T: trabecular thickness, Tb.N: trabecular number, OcS/BS: osteoclast surface per bone surface, MS/BS (%): the ration of mineralized area to bone surface area, MAR: mineral apposition rate

