
Fig. 2.
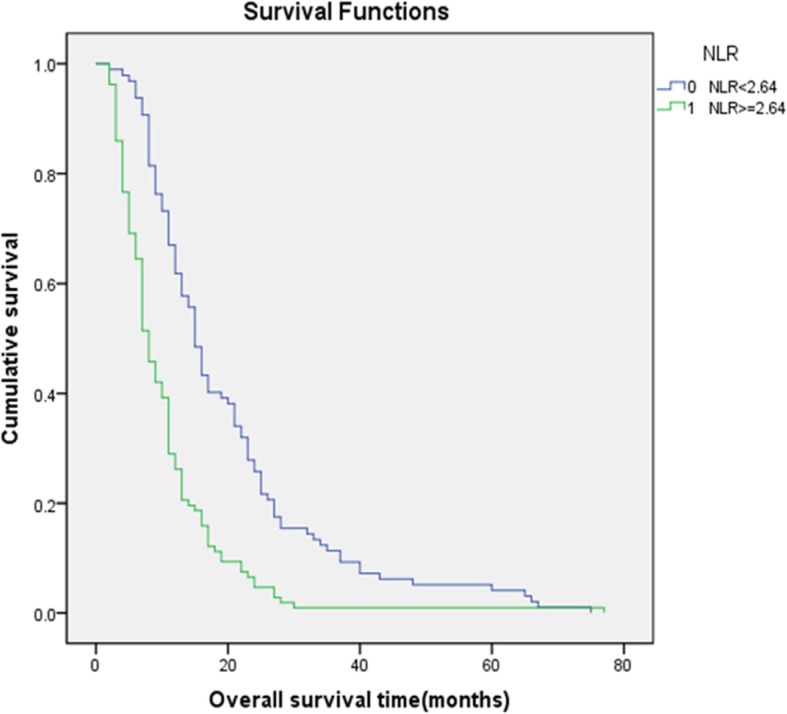
Kaplan-Meier survival curves for patients with advanced oesophageal cancer in different NLR groups. The blue curve represents the overall survival of patients with an NLR less than 2.64, while the green curve represents the overall survival of patients with an NLR greater than or equal to 2.64. The mean survival time of patients in the low NLR group was 19.8 months, and the mean survival time of patients in the high NLR group was 10.3 months, with a p < 0.05, indicating a significant difference between the two groups