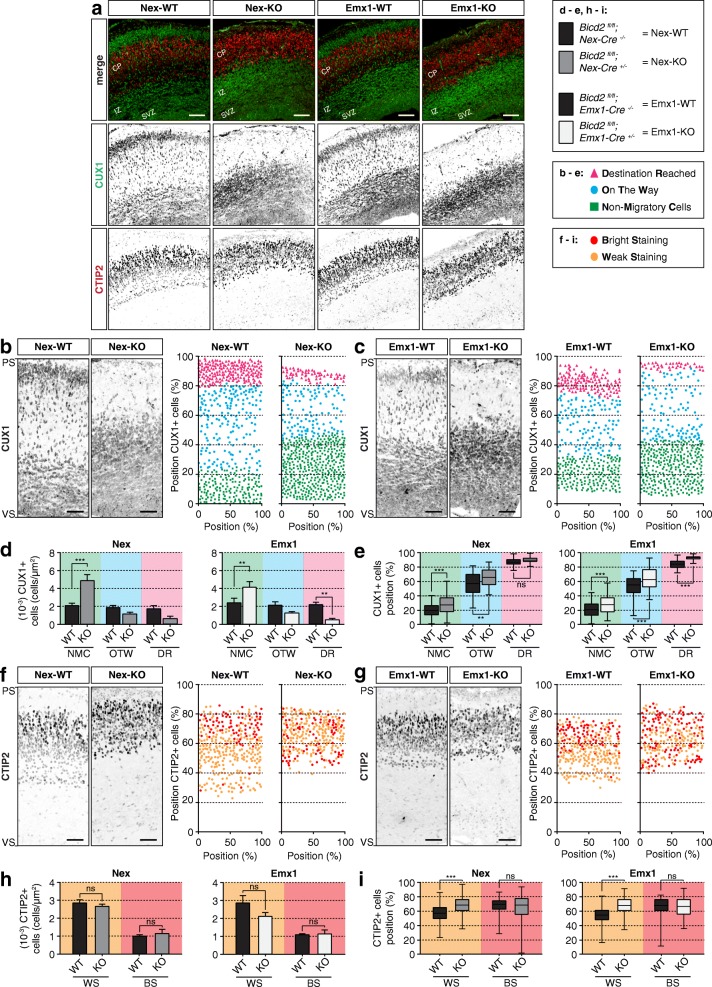
Fig. 2.
BICD2 is essential for radial migration of upper-layer neurons but not for the migration of deeper-layer neurons. a. Coronal cryo-sections of E17.5 cortices from cell-type-specific conditional Bicd2 KO mice and their control littermates - Bicd2fl/fl;Nex-Cre+/− (=Nex-KO), Bicd2fl/fl;Emx1-Cre+/− (=Emx1-KO), Bicd2fl/fl;Nex-Cre−/− (=Nex-WT) and Bicd2fl/fl;Emx1-Cre−/− (=Emx1-WT) respectively - were stained against the deeper cortical layer (V/VI) marker CTIP2 (red) and the superficial layer marker CUX1 (green). Scale bars are 100 μm. b + c. Selected areas from ventricular (VS) to pial surface (PS) and 156.3 μm width (left panels) and graphical representation of the relative position of CUX1+ cells over the cortical longitude from VS to PS (in %) and 156.3 μm in width (in %) which did not migrate (Non-Migratory Cells = green), were still migrating (On The Way = blue) and reached cortical layer II/III (Destination Reached = pink) (right panels) for Nex-WT and Nex-KO mice (b) and Emx1-WT and Emx1-KO mice (c). Scale bars are 50 μm. d + e. Number (10− 3) of CUX1+ cells per μm2 (d) and their distribution cells as relative position over the cortical longitude from VS to PS (in %) (e) which did not migrate (NMC: Non-Migratory Cells = green), were still migrating (OTW: On The Way = blue) and reached cortical layer II/III (DR: Destination Reached = pink) for Nex-WT and Nex-KO mice (left) and Emx1-WT and Emx1-KO mice (right) (N = 3–4, n = 389–611). f + g. Selected area from VS to PS and 156.3 μm width (left panels). Layer VI neurons show weak CTIP2 staining (light gray) and layer V neurons bright CTIP2 staining (dark gray). Scale bars are 50 μm. Right panels are graphical representations of the relative position of CTIP2+ layer VI neurons with weak CTIP2 staining (WS, yellow) and layer V neurons with bright CTIP2 staining (BS, red) over the cortical longitude from VS to PS (in %) and 156.3 μm in width (in %) for Nex-WT and Nex-KO mice (f) and Emx1-WT and Emx1-KO mice (g). h + i. Number (10− 3) of CTIP2+ cells per μm2 (h) and their distribution cells as relative position over the cortical longitude from VS to PS (in %) (i) with weak CTIP2 staining (WS, yellow) and bright CTIP2 staining (BS, red) for Nex-WT and Nex-KO mice (left) and Emx1-WT and Emx1-KO mice (right) (N = 3–4, n = 232–398). CP: cortical plate, IZ: intermediate zone, PS: pial surface, SVZ: subventricular zone, VS: ventricular surface. *** p < 0.001, ** p < 0.005, * p < 0.05, ns = not significant; error bars are ±SEM. Used tests: One-Way ANOVA with Sidak’s multiple comparisons (d, h), Kruskal Wallis test with Dunn’s multiple comparisons (e, i)

