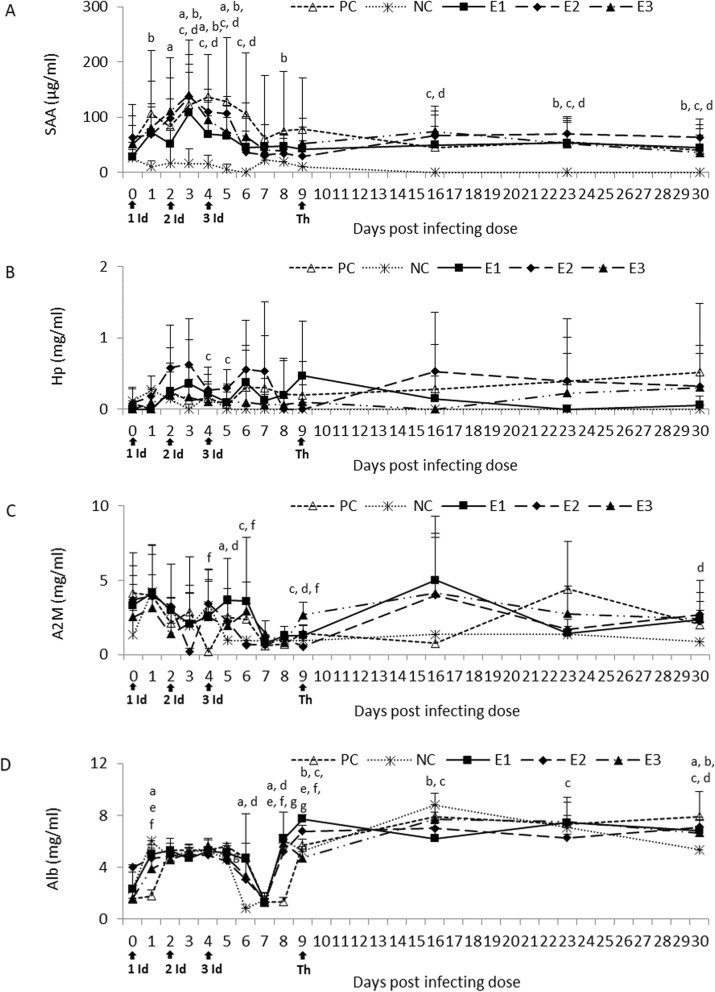
Fig. 3.
SAA (a), Hp (b), A2M (c) and Alb (d) concentration in the sera of the experimental and control calves post treatment. NC, negative control; PC, positive control; E1, group received enrofloxacin alone; E2, group received enrofloxacin combined with flunixin meglumine; E3, group received enrofloxacin combined with flunixin meglumine and pegbovigrastim; 1, 2, 3 Id – the 1st, 2nd and 3rd infecting dose of M. bovis; Th – day of therapy starting; a, P < 0.05 between groups PC and NC b, P < 0.05 between groups E1 and NC; c, P < 0.05 between groups E2 and NC; d, P < 0.05 between groups E3 and NC e, P < 0.05 between groups E1 and PC; f, P < 0.05 between groups E2 and PC; g, P < 0.05 between groups E3 and PC

