Figure 2.
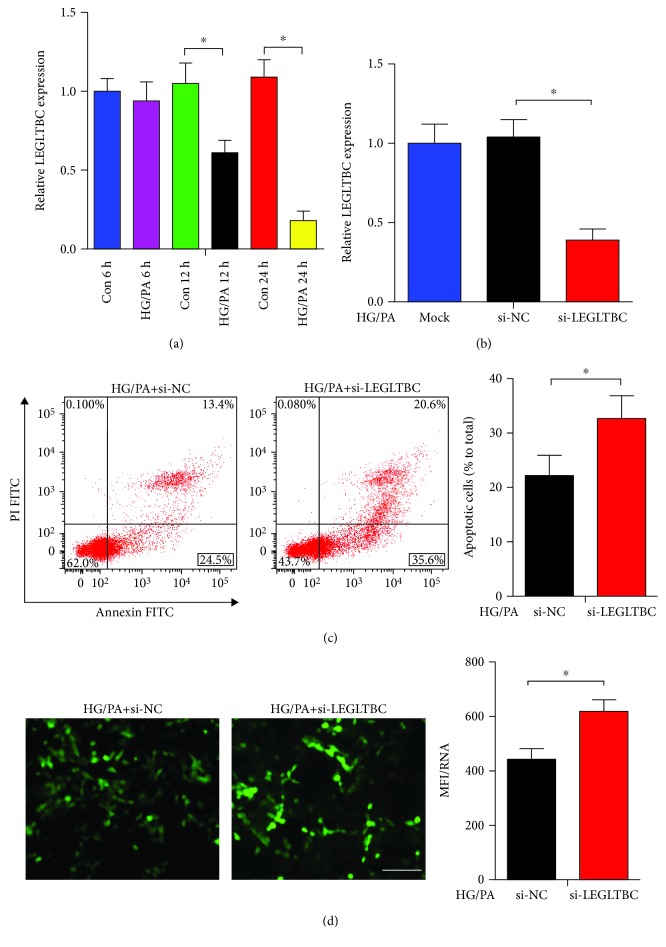
Silencing LEGLTBC induces oxidative stress and apoptosis in glucolipotoxicity. (a) The expression of LEGLTBC in HG/PA-treated INS-1 cells was assessed by qRT-PCR analysis. (b) Downregulation of LEGLTBC using siRNA for 48 h as detected by qRT-PCR analysis. (c) INS-1 cells were stained with Annexin V-FITC and PI and then subjected to flow cytometry to measure apoptosis. Apoptotic cells shown as Annexin V-positive cells were mainly located in the right lower quadrant. The apoptotic rate was calculated as the percentage of Annexin V-positive cells divided by the total number of cells. (d) The generation of intracellular ROS was assessed using DCFH-DA. The green signal of DCF was captured by a fluorescence microscope as presented. Scale bar = 50 μm. ROS levels were calculated using the fluorescence value (mean fluorescence intensity (MFI) of DCF) and calibrated with the total RNA concentration. The intracellular ROS levels in different groups are shown in the histograms. Results are presented as means ± SD of n = 4‐5 independent experiments. ∗Conditions significantly different (P < 0.05).

