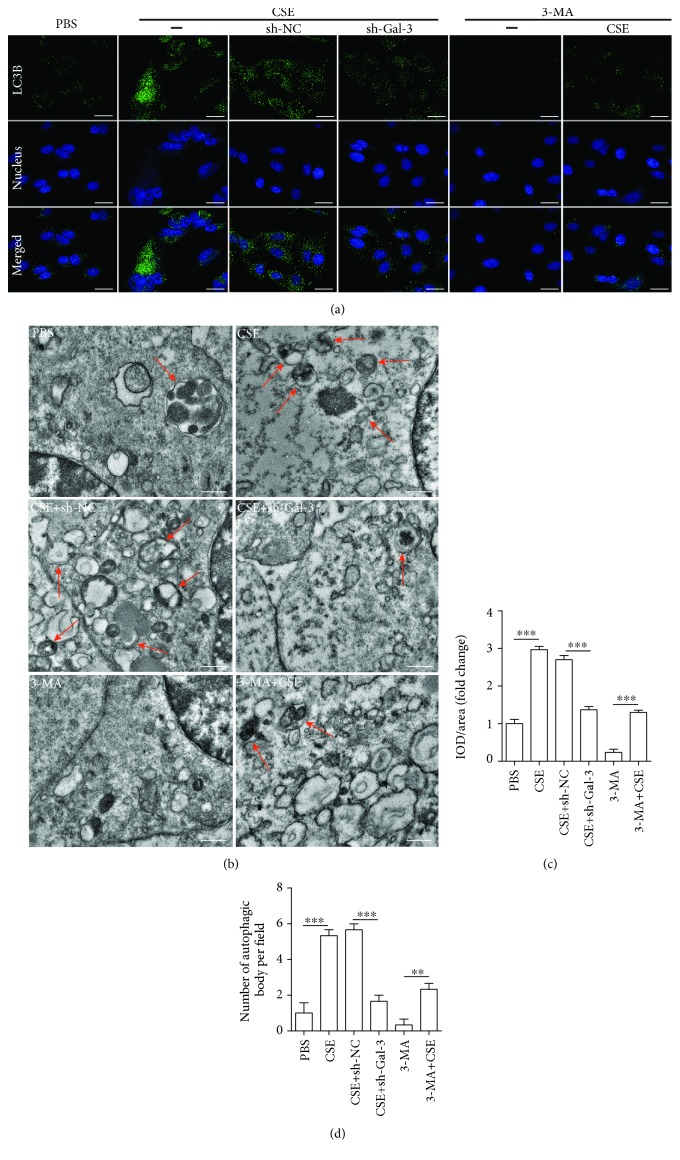
Figure 6.
Microscopic observation of the effect of galectin-3 inhibition on CSE-induced EPC autophagy. EPCs were infected by shRNA-Gal3 (shRNA-1) and shRNA-NC before being treated with 8% of CSE for 24 h. 3MA (an autophagy inhibitor) served as a control. Immunofluorescence of LC3B expression on the cell membrane of EPCs in different groups (a) (scale bar = 100 μm). Quantification of IOD/area per field (c). Representative transmission electron microscopy images showing the autophagosomes (red arrows) in EPCs from different groups (b) (scale bar = 1 μm). The number of autophagosomes per cell (d). Data are represented as mean ± SD. n ≥ 3. ∗∗p < 0.00 and ∗∗∗p < 0.001 vs. the respective group.

