
. 2019 Oct 13;2019:7828590. doi: 10.1155/2019/7828590
Copyright © 2019 Ahmed Bir-Jmel et al.
This is an open access article distributed under the Creative Commons Attribution License, which permits unrestricted use, distribution, and reproduction in any medium, provided the original work is properly cited.
Figure 1.
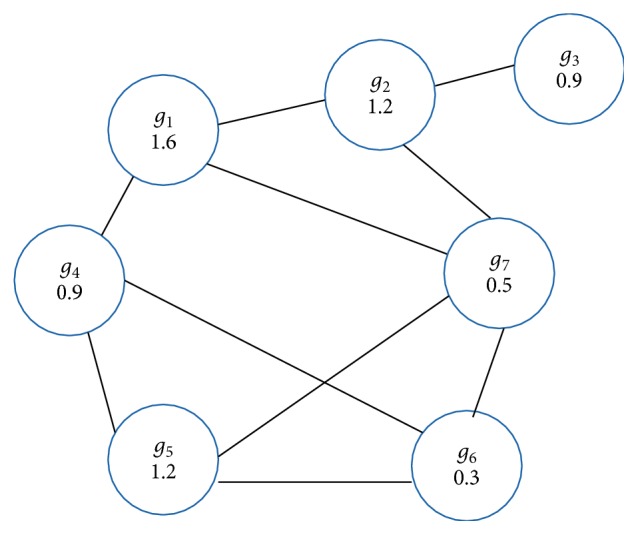
An example of gene-similarity graph.