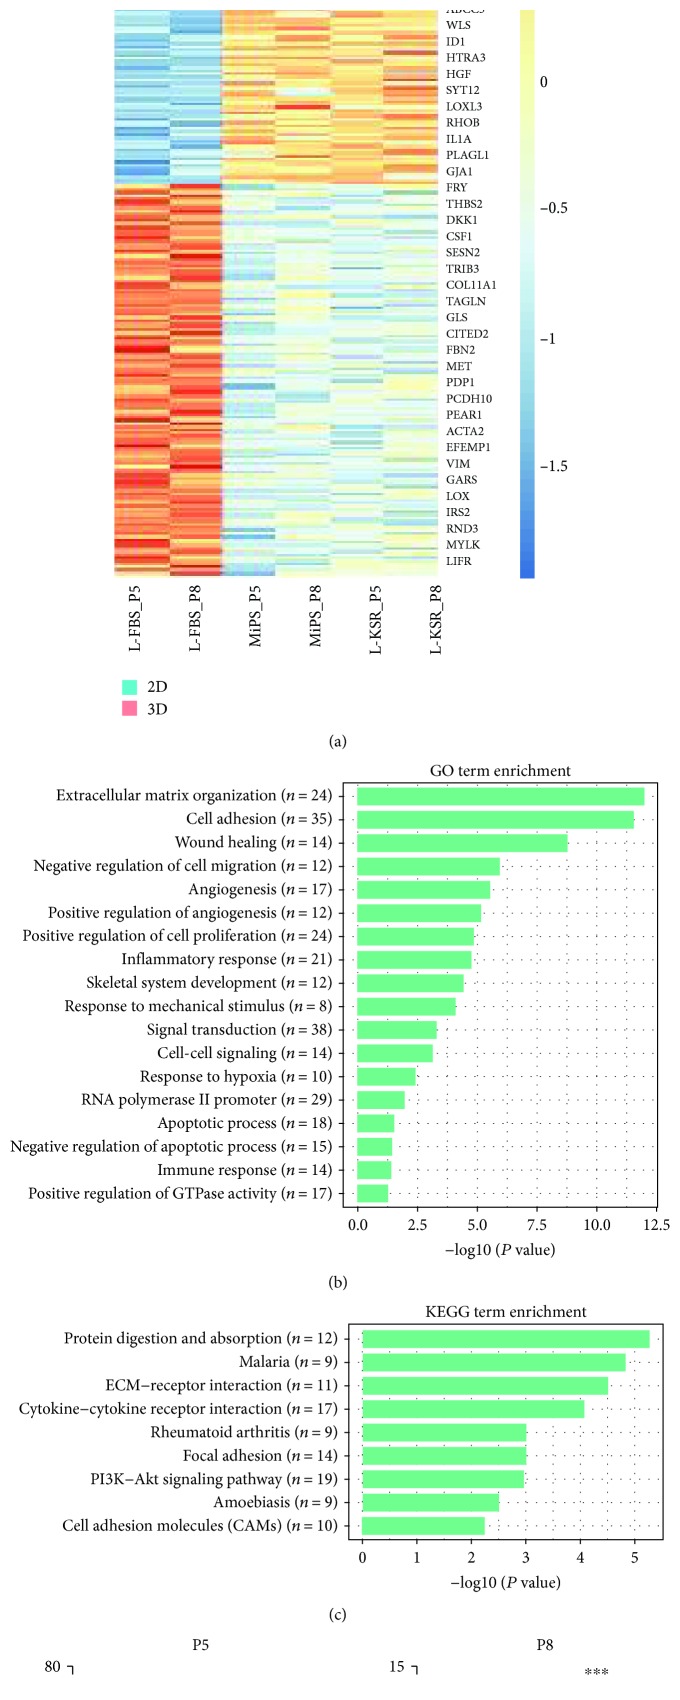
Figure 4.
Transcriptomic expression analysis of hMSC spheroids. (a) The heatmap shows scaled expression [log2 (FPKM + 1)] of discriminative genes between 3D spheroids (both in MiPS and in L-KSR) and 2D normal MSCs (in L-FBS medium) at day 6 at P5 and P8. Adjusted P value<0.05. The color scheme is based on z-score distribution from 2 (blue) to 2 (red). (b) Gene ontology (GO) analysis between 3D and 2D; “n” indicates gene numbers. (c) KEGG analysis between 3D and 2D. (d) qPCR result analysis of STC1, CCL7, HGF, IL24, and TGFB3 between 3D and 2D cells at P5 and P8 at day 6. The expression levels of genes of interest to that of GAPDH. Not significant (NS); P ≥ 0.05, ∗P < 0.05, ∗∗P < 0.01, and ∗∗∗P < 0.001.

