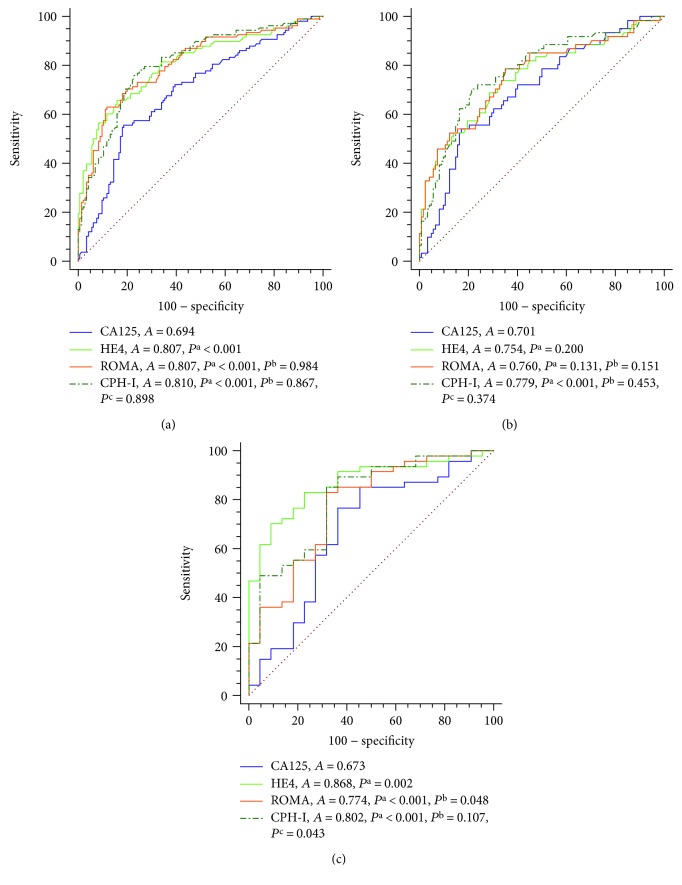
Figure 1.
ROC curve analysis of the diagnostic values of CA125 and HE4 levels and ROMA and CPH-I indices for BOT I+II and EOC I+II of all patients (a), premenopausal patients (b), and postmenopausal patients (c). Abbreviations: Pre-M = premenopausal; Post-M = postmenopausal; A = AUC-ROC; Pa, Pb, and Pc = P value of AUC-ROC compared with CA125, HE4, and ROMA, respectively.

