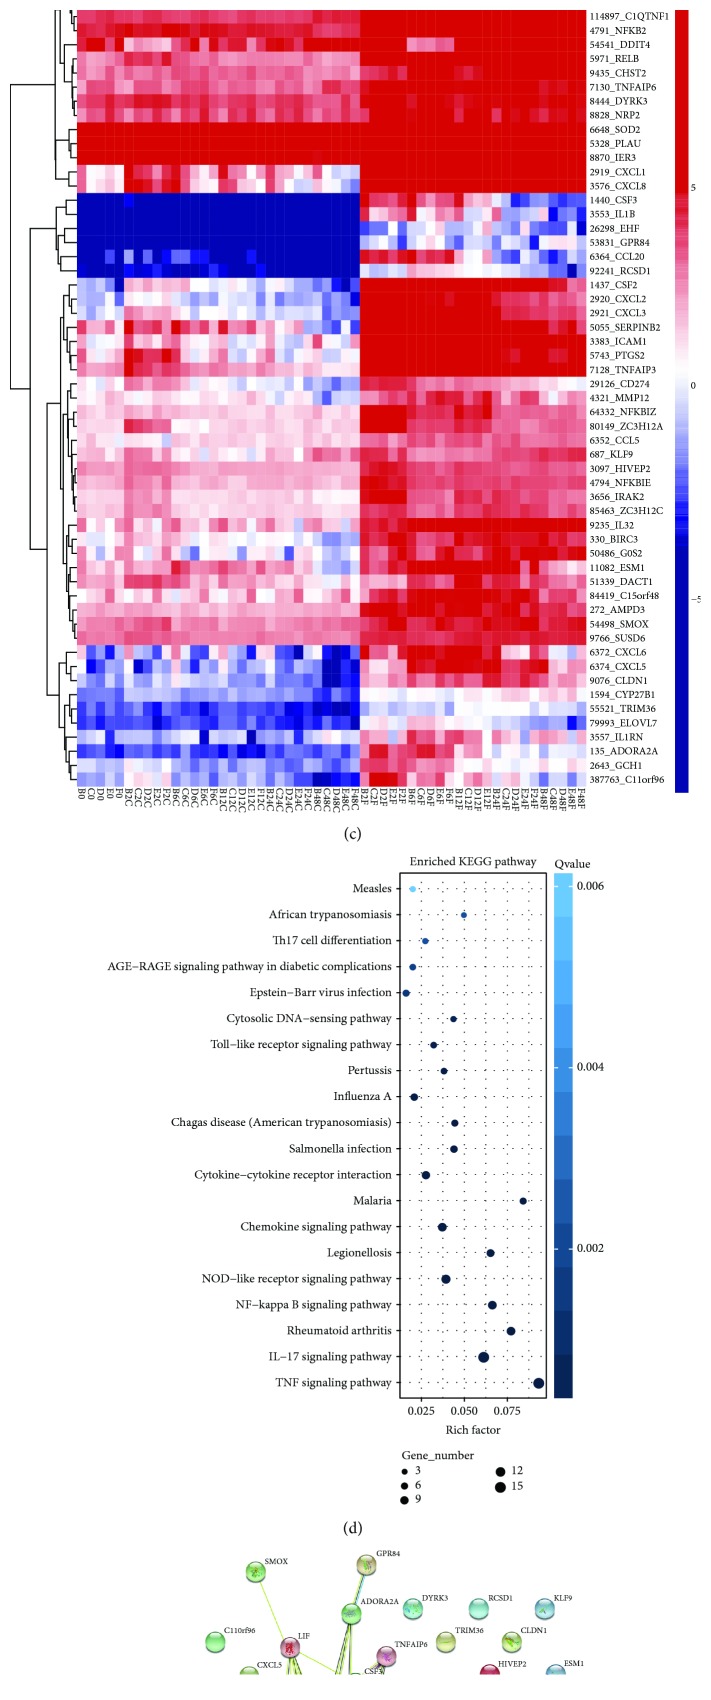
Figure 1.
RNA-sequencing analysis of GFs stimulated with F. nucleatum (MOI of 100). (a) The number of DEGs in 54 samples after F. nucleatum stimulation at 2 h, 6 h, 12 h, 24 h, and 48 h. (b) Venn diagram summarizing the overlapping DEGs among the five time points. (c) Heat map of the 62 overlapping DEGs. (d) KEGG enrichment analysis of the 62 overlapping DEGs. (e) Network of 62 overlapping DEGs after F. nucleatum stimulation at 2 h, 6 h, 12 h, 24 h, and 48 h.

