Figure 2.
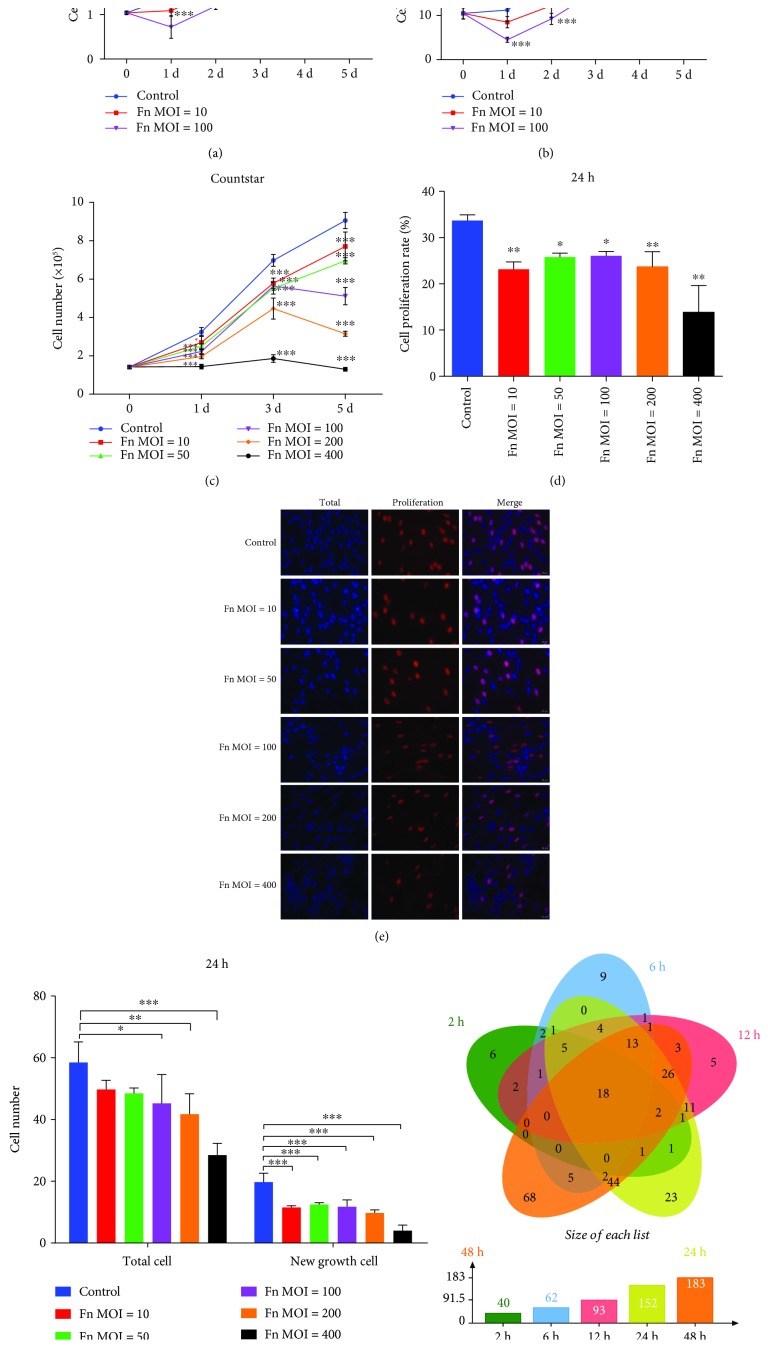
Effects of F. nucleatum on cell proliferation. Cell numbers of GFs detected by an electronic cell counter (a) and hemocytometer (b) with or without F. nucleatum stimulation at MOIs of 10 and 100 (n = 6). (c) Number of GFs detected by electronic cell counter after F. nucleatum stimulation (MOIs of 0, 10, 50, 100, 200, and 400, n = 6). (d) Cell proliferation rate of GFs detected by EdU assay (n = 6). (e) EdU assay of GFs after F. nucleatum stimulation (MOIs of 0, 10, 50, 100, 200, and 400) at 24 h. Scale bar: 20 μm. NC: negative control; PC: positive control. (f) Statistical results of total and new cell growth after EdU labeling (n = 6). (g) Venn diagram of cell proliferation-related DEGs from the GO biological process analysis among the five time points. All data are shown as the mean ± SD. Statistical analyses were performed by one-way (d) and two-way (a, b, c, f) ANOVA with Tukey's multiple-comparison test. ∗P < 0.05, ∗∗P < 0.01, and ∗∗∗P < 0.001 compared with the Control.

