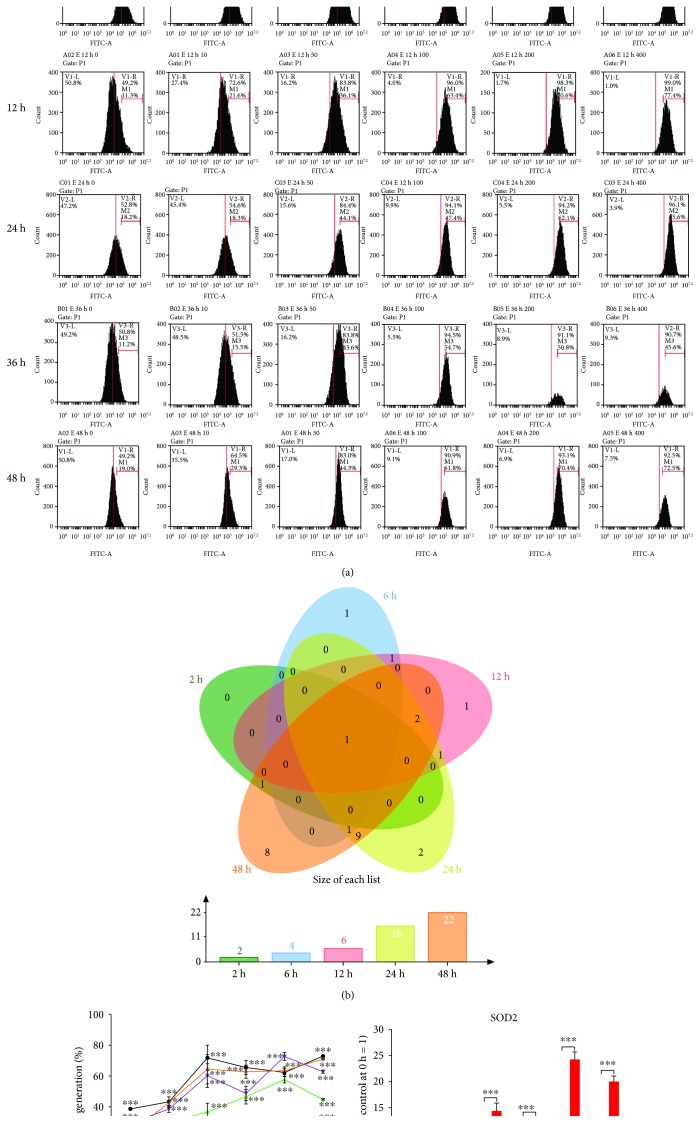
Figure 4.
Effects of F. nucleatum on ROS generation in GFs. (a) Flow cytometry analysis of ROS production with F. nucleatum stimulation (MOIs of 0, 10, 50, 100, 200, and 400) at 2 h, 6 h, 12 h, 24 h, and 36 h. (b) Venn diagram of ROS production-related DEGs from the GO biological process analysis after the five paired comparisons. (c) Statistical results of ROS generation by flow cytometry (n = 3). (d) The relative gene expression level of SOD2 by qRT-PCR. The histogram represents the mean ± SD. Statistical analyses were performed by two-way ANOVA with Turkey's multiple-comparison test (c) and multiple t-test (d). ∗P < 0.05 and ∗∗∗P < 0.001 compared with the control at each time point.

