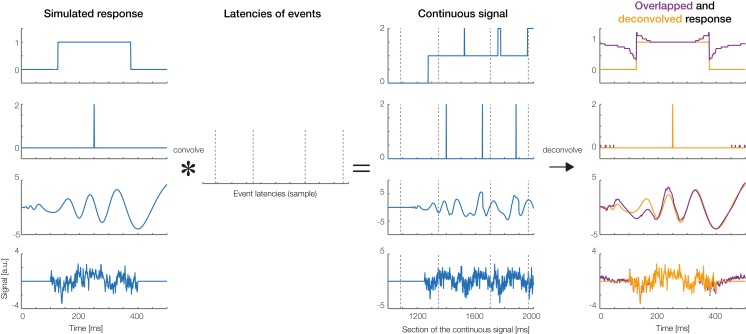
Figure 10. Deconvolution results for simulated signals.
Four types of responses (first column: box car, Dirac function, auditory ERP, pink noise) were convolved with random event latencies (second column). A section of the resulting overlapped signal is shown in the third column. The fourth column shows the deconvolved response recovered by the unfold toolbox (orange lines). Overlapped responses (without deconvolution) are plotted as violet lines for comparison.

