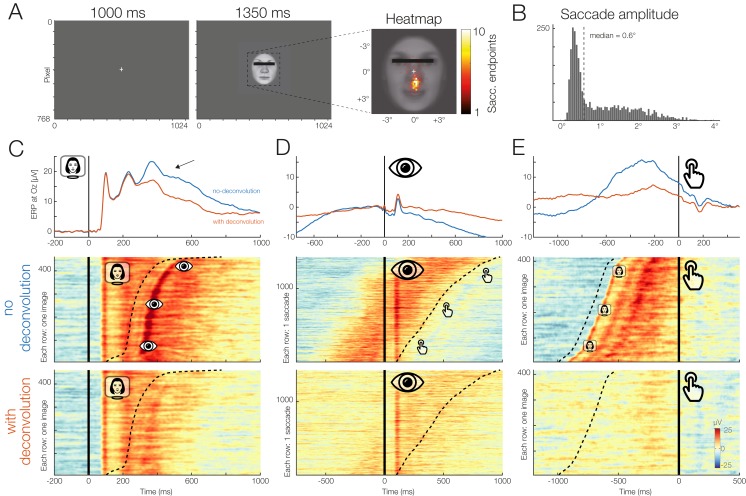
Figure 11. Example dataset with stimulus onsets, eye movements, and button presses.
(A) Panel adapted from Dimigen & Ehinger (2019). The participant was shown a stimulus for 1,350 ms. (B) The subject was instructed to keep fixation, but as the heatmap shows, made many small involuntary saccades towards the mouth region of the presented stimuli. Each saccade also elicits a visually-evoked response (lambda waves). (C–E) Latency-sorted and color-coded single-trial potentials at electrode Oz over visual cortex (second row) reveal that the vast majority of trials contain not only the neural response to the face (C) but also hidden visual potentials evoked by involuntary microsaccades (D) as well as motor potentials from preparing the button press (E). Deconvolution modeling with unfold allows us to isolate and remove these different signal contributions (see “no deconvolution” vs. “with deconvolution”), resulting in corrected ERP waveforms for each process (blue vs. red waveforms). This reveals, for example, that a significant part of the P300 evoked by faces (arrow in (C)) is really due to microsaccades and button presses and not the stimulus presentation.

