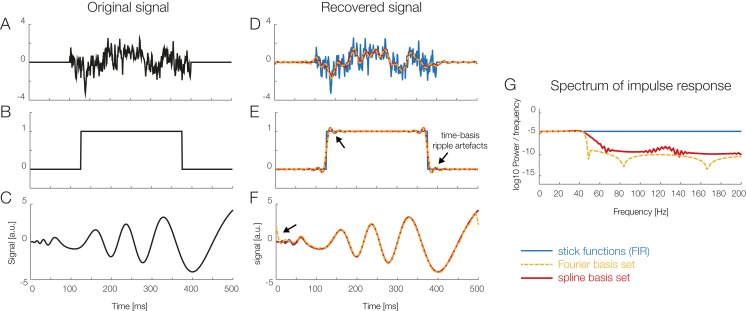
Figure 6. Using temporal basis functions.
Effect of using different time basis functions on the recovery of the original signal using deconvolution. (A–C) Show three different example signals without deconvolution (in black) and with convolution using different methods for the time-expansion (stick, Fourier, spline). We zero-padded the original signal to be able to show boundary artifacts. For the analysis we used 45 time-splines and in order to keep the number of parameters equivalent, the first 22 cosine and sine functions of the Fourier set. The smoothing effects of using a time-basis set can be best seen in the difference between the blue curve and the orange/red curves in (D). Artifacts introduced due to the time-basis set are highlighted with arrows and can be seen best in (E) and (F). Note that in the case of realistic EEG data, the signal is typically smooth, meaning that ripples like in (E) rarely occur. (G) The impulse response spectrum of the different smoothers. Clearly, the Fourier-set filters better than the splines, but splines allow for a sparser description of the data and could benefit in the fitting stage.

