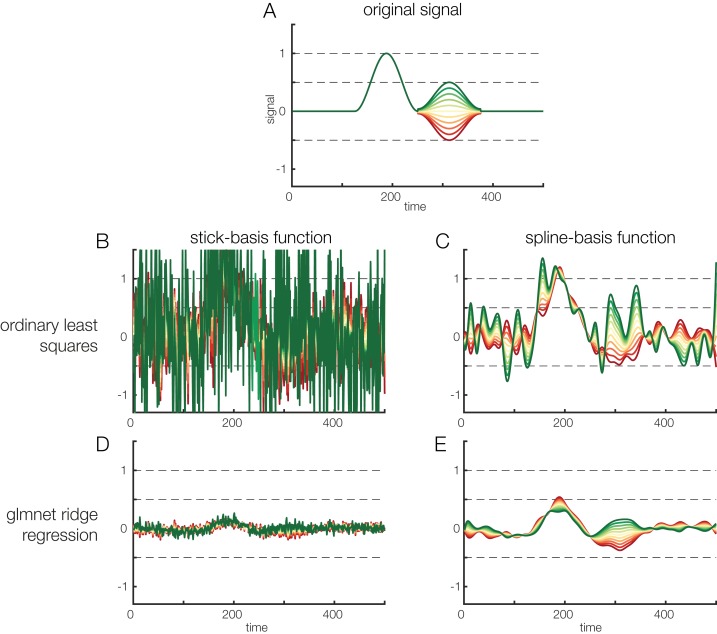
Figure 7. Regularization options.
Effects of regularization on deconvolving noisy data. Results of regularization are shown both for a model with stick-functions and for a model with a temporal spline basis set. (A) To create an overlapped EEG signal, we convolved 38 instances of the original signal depicted in (A). The effect of a continuous covariate was randomly added to each event (see different colors in A). To make the data noisy, we added Gaussian white noise with a standard deviation of 1. Finally, to illustrate the power of regularization, we also added another random covariate to the model. This covariate had no relation to the EEG signal but was highly correlated (r = 0.85) to the first covariate. Thus, the model formula was: EEG ∼ 1 + covariate + randomCovariate. (B) Parameters recovered based on ordinary least squares regression. Due to the low signal-to-noise ratio of the data, the estimates are extremely noisy. (C) Some smoothing effect can be achieved by using time-splines as a temporal basis set instead of stick functions. (D) The same data, but deconvolved using a L2-regularized estimate (ridge regression). It is obvious that the variance of the estimate is a lot smaller. However, compared to the original signal shown in (A), the estimated signal is also much weaker, i.e., there is a strong bias. (E) L2-regularized estimates, computed with a time-spline basis set. This panel shows the usefulness of regularization: the effect structure can be recovered despite strong noise, although the recovered effect is again strongly biased (due to the variance/bias tradeoff).

