

Abstract
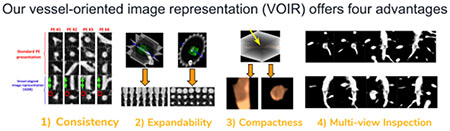
Diagnosing pulmonary embolism (PE) and excluding disorders that may clinically and radiologically simulate PE poses a challenging task for both human and machine perception. In this paper, we propose a novel vessel-oriented image representation (VOIR) that can improve the machine perception of PE through a consistent, compact, and discriminative image representation, and can also improve radiologists’ diagnostic capabilities for PE assessment by serving as the backbone of an effective PE visualization system. Specifically, our image representation can be used to train more effective convolutional neural networks for distinguishing PE from PE mimics, and also allows radiologists to inspect the vessel lumen from multiple perspectives, so that they can report filling defects (PE), if any, with confidence. Our image representation offers four advantages: (1) efficiency and compactness—concisely summarizing the 3D contextual information around an embolus in only three image channels, (2) consistency—automatically aligning the embolus in the 3-channel images according to the orientation of the affected vessel, (3) expandability—naturally supporting data augmentation for training CNNs, and (4) multi-view visualization—maximally revealing filling defects. To evaluate the effectiveness of VOIR for PE diagnosis, we use 121 CTPA datasets with a total of 326 emboli. We first compare VOIR with two other compact alternatives using six CNN architectures of varying depths and under varying amounts of labeled training data. Our experiments demonstrate that VOIR enables faster training of a higher-performing model compared to the other compact representations, even in the absence of deep architectures and large labeled training sets. Our experiments comparing VOIR with the 3D image representation further demonstrate that the 2D CNN trained with VOIR achieves a significant performance gain over the 3D CNNs. Our robustness analyses also show that the suggested PE CAD is robust to the choice of CT scanner machines and the physical size of crops used for training. Finally, our PE CAD is ranked second at the PE challenge in the category of 0mm localization error.
Keywords: Computer-aided detection, pulmonary embolism, convolutional neural networks, vessel-aligned image representation, vessel-oriented image representation
Graphical Abstract
1. Introduction
Pulmonary embolism (PE) is a “blood clot” that travels from the legs, or less commonly other parts of the body, to the lungs where it blocks central, lobar, segmental, or sub-segmental pulmonary vessels depending on its size. PE, if left undiagnosed, leads to a mortality rate that may approach 30% Calder et al. (2005). However, with early diagnosis and treatment, the mortality rate decreases to as low as 2% Sadigh et al. (2011). The primary imaging technique for PE diagnosis is computed tomography pulmonary angiography (CTPA), in which PE appears as a filling defect in the bright lumen of a pulmonary artery (see Figure 1).
Figure 1:

In CTPA datasets, an embolus appears as a dark filling defect surrounded by the bright, contrast-enhanced, vessel lumen. (a) An embolus causing a mild degree of obstruction in a segmental artery. (b) A large embolus in a segmental artery. The left, middle, and right columns present the axial, sagittal, and coronal image planes, respectively.
However, PE diagnosis in CTPA studies is not trivial. First, PE can appear in central, segmental, or subsegmental arteries; therefore, radiologists need to inspect the large network of pulmonary arteries through numerous CT slices in search of a filling defect. Second, PE appears in various sizes and degrees of arterial occlusion, requiring radiologists to be very sensitive to the visual characteristics of PE. Third, PE diagnosis can be compromised in the presence of other pulmonary diseases or when the quality of the CT image is degraded, because both factors can cause a plethora of PE mimics in images, which need to be distinguished from the actual emboli. Therefore, PE diagnosis can be a tedious, time-consuming, and error-prone task.
Computer-aided PE diagnosis has however proved effective Engelke et al. (2008); Maizlin et al. (2007); Buhmann et al. (2007) in improving radiologists’ diagnostic capabilities for PE assessment, but at the price of prolonged interpretation sessions. This is because the existing CAD systems generate a relatively large number of false markings, which all have to be reviewed by radiologists. Another limitation of the current CAD systems is that they are not equipped with a rapid inspector by which radiologists can quickly review each CAD marking. Excessive time spent adjudicating CAD assessments creates a workflow radiologists find unacceptable and may even impair the ultimate purpose of PE CAD—facilitating PE diagnosis.
In this paper, we propose a novel, compact, and discriminative image representation to tackle the large number of false alarms and the lack of an effective PE visualization module. Specifically, we present a computer-aided PE diagnosis system which, in addition to generating an accurate set of PE markings, provides radiologists with an effective visualization tool so they can conveniently examine the vessel lumen from multiple perspectives and report filling defects, if any, with confidence. Our vessel-oriented image representation (VOIR1) offers four advantages: (1) efficiency and compactness—concisely summarizing the 3D contextual information around an embolus using only 3 image channels, (2) consistency—automatically aligning the embolus in the 3-channel images according to the orientation of the affected vessel, (3) expandability—naturally supporting data augmentation for training CNNs, and (4) multiview finding visualization—optimally demonstrating the filling defects. Advantages 1–3 are utilized in training an accurate false positive reduction model based on convolutional neural networks, while advantage 4 is used in our PE visualization system. The capability of our system for visualizing suspicious findings combined with its improved false positive reduction model makes our system more suitable for clinical practice.
This work is a significant extension of our previous work2 Tajbakhsh et al. (2015a), which was presented in MICCAI 2015. In addition to the original contributions presented in Tajbakhsh et al. (2015a), we now report the following new contributions:
we have introduced a visualization system based on VOIR that can be used for inspecting suspicious findings from multiple perspectives.
we have included two additional competing image representations in our experiments: a 3D representation and a 2D representation based on the standard clinical views, which allow us to more rigorously evaluate the competence of VOIR.
we have expanded the experiment section by including several additional CNN architectures of varying depths, which allow us to investigate the relationship between image representations and deepness of CNN architectures.
we have studied the effectiveness of VOIR in the absence of large training data sets by training all architectures using the entire, half, and a quarter of the training set.
we have included robustness analyses to study how the suggested PE CAD, which has VOIR in its backbone, is affected by the choice of CT scanner machines as well as the physical size of crops used for training.
we have studied the impact of VOIR on the convergence speed of CNNs by introducing the notion of “area under the convergence curve”.
2. Related work
2.1. PE CAD
Development of CAD systems for PE and the clinical evaluations of such systems have been an active area of research over the past two decades. Table 1 compares the existing systems for computer-aided detection of PE. As seen, in general, the existing systems consist of four stages: 1) extracting a volume of interest (VOI) from the original dataset by performing lung or vessel segmentation, 2) generating a set of PE candidates within VOIs using algorithms such as tobogganing Fairfield (1990), extracting handcrafted features from each PE candidate, and computing a PE score by means of a probabilistic classifier for each of the candidates. We proposed a drastic shift in this paradigm in our previous work Tajbakhsh et al. (2015a) wherein a new image representation coupled with CNNs was used to localize PE in CTPA datasets. Our image representation was later adopted by Zhou et al. (2017) for the task of active learning. To our knowledge, our previous work has been the only instance wherein CNNs are used for PE diagnosis. However, with the release of more public data Masoudi et al. (2018), we anticipate an accelerated pace of research and development for automated diagnosis of PE using deep learning.
Table 1:
A summary of the systems designed for computer-aided diagnosis of PE. (ANN: Artificial neural network, EM: Expectation maximization, CC: Connected component, Knn: K-nearest neighbor)
| Pipeline |
|||||||||||||
|---|---|---|---|---|---|---|---|---|---|---|---|---|---|
| Publication | 1) VOI extraction |
2) Candidate generation |
3.1) PE features |
3.2) Vessel features |
4) Candidate classification |
||||||||
| Vessel seg. | Lung seg. | EM | Tobogganing | CC | Shape | Intensity | Boundary | Shape | Location | Rules | ANN+Knn | Bagged trees | |
| Zhou et al. (2005) | ✓ | ✓ | ✓ | ✓ | |||||||||
| Bouma et al. (2009) | ✓ | ✓ | ✓ | ✓ | ✓ | ✓ | ✓ | ✓ | |||||
| Park etal. (2011) | ✓ | ✓ | ✓ | ✓ | ✓ | ✓ | |||||||
| Özkan et al. (2014) | ✓ | ✓ | ✓ | ✓ | |||||||||
| Wang et al. (2012) | ✓ | ✓ | ✓ | ✓ | ✓ | ✓ | ✓ | ||||||
| Al-hinnawi et al. (2018) | ✓ | ✓ | ✓ | ||||||||||
| Tajbakhsh et al. (2015a) | ✓ | ✓ | ————A new image representation for PE + CNN———— | ||||||||||
2.2. Image representation for CNNs
Image representation can substantially influence the performance of CNNs for object detection and recognition. This impact was first demonstrated in Ciresan et al. (2012), in which the experiments conducted for multiple datasets showed that CNNs trained using patches undergoing different intensity transformations have complementary discrimination power. The impact of image representation was also studied in Tajbakhsh et al. (2015b) where histogram-equalized image patches were found to improve the performance of CNNs for polyp detection in colonoscopy videos.
The choice of image representation becomes even more crucial when considering 3D applications. While the use of a subvolume may appear to be a natural image representation for a 3D application, it incurs substantial computational cost Prasoon et al. (2013); Roth et al. (2016), restricts the designers to using shallower architectures, and may run the risk of over-fitting when only limited labeled data is available for training. Also, while 2D CNNs can benefit from transfer learning Tajbakhsh et al. (2016), pre-trained 3D models are not yet as widespread as their 2D counterparts, and their quality may not be as competitive because the sizes of labeled medical imaging datasets are far smaller than the ImageNet database. Therefore, it may be desired to compress the 3D context into a 2D representation and then take advantage of the pre-trained 2D models.
Devising effective image representations for 3D medical datasets has been only briefly studied so far. The common approach to avoid a high dimensional subvolume around an abnormality is to form 3-channel patches using standard image planes (sagittal, coronal, and axial planes) Prasoon et al. (2013). However, this approach may not fully leverage the 3D information embedded in the 3D context. Setio et al. Setio et al. (2016) suggested a multi-view approach wherein the subvolume around an abnormality is interpolated in a number of predefined image planes. The drawback to this approach is that one needs to train a separate CNN model for each orientation of the interpolated image planes. Roth et al. Roth et al. (2016, 2014) suggested a 2.5D image representation that can more effectively leverage information embedded in a subvolume. Their image representation yields 3-channel patches where each channel is computed by interpolating the volume along 2 random spatial directions. In our previous work, we suggested a new context-aware image representation Tajbakhsh et al. (2015a) that aligns itself with the vessel containing the abnormality. Our image representation differs from the 2.5D approach in that it interpolates the volume according to the vessel axis rather than along random directions as in Roth et al. (2016, 2014).
3. Suggested image representation (VOIR)
An embolus appears as a filling defect inside a contrast-enhanced pulmonary artery. If a segment of artery with an embolus is oriented obliquely to the standard image plane (axial, sagittal, or coronal), the embolus may not be seen clearly. Our simple yet effective solution is to “reformat” the image planes in alignment with the vessel longitudinal axis. This interpolation scheme guided by the vessel axis has the effect of maximally revealing the filling defects, thereby facilitating PE diagnosis for both radiologists and machines. Indeed, vessel orientation estimation serves as the backbone of both our diagnostic and visualization systems. Therefore, we first introduce how we estimate the vessel orientation and then explain how it is used in our PE visualization and diagnosis system.
3.1. Estimating orientation of containing vessel
Our CAD system employs the tobogganing algorithm Fairfield (1990) for candidate generation which, in addition to the candidate location, outputs the voxels that comprise the PE candidate (segmentation). The tobogganing algorithm can scan the entire volume or can be initiated at a locus provided by a radiologist. let Sc denote the segmented region for candidate c generated by the tobogganing algorithm. To estimate the orientation of the containing vessel, we extract a subvolume centered on the given location, Vc = V(cx – i, cy – j, cz – k) where i,j,k are determined according to the physical size of the subvolume. We then replace voxel intensities within the segmented region, Sc, with a constant vessel-like intensity of 1100 HU, Vc(x, y, z) = 1100 if (x, y, z) ∈ Sc. This scheme has the effect of filling the defect inside and on the surface of the containing vessel. Once the defect is filled, we identify the vessel voxels by choosing the largest connected component in Vc after thresholding the subvolume with a vessel-like intensity threshold of 1100 HU. Note that if the filling defect is not identified using the aforementioned approach, the voxels comprising the PE would be excluded from the largest connected component of the vessel, significantly altering the estimated shape of the vessel and hence the estimation of the vessel’s orientation.
Let In×3 denote a matrix that has in its rows the coordinates of the vessel voxels from the largest connected component. We compute the vessel orientation by performing a PCA analysis on matrix I. Mathematically, we solve for where , , are the eigen vectors of the analyzed component and λ1, λ2, λ3 are the eigen values (λ1 > λ2 > λ3). Because λ1 is the largest eigen value, determines the vessel orientation. Also, vectors {} or {} span planes that extend longitudinally through the vessels and the vectors {} span the plane that extends transversely across the vessel.
3.2. PE candidate visualization
Given a location selected by a radiologist or by a candidate generation method, our PE visualization system generates two animations for review. The first animation shows how the z-axis rotates towards the vessel orientation, whereas the second animation visualizes the filling defect from multiple perspectives after the vessel axis is aligned with the y-axis of the 2D display window.
3.2.1. Animation I: axis alignment
The first animation is generated according to Euler’s rotation theorem Craig. Basically, in 3D space, any two Cartesian coordinate systems with the same origin are related by a rotation about some fixed axis at some degree of angle θ:
| (1) |
| (2) |
where rig are the entities of matrix R computed as R = A⊺ A′ with A and A′ denoting rotation matrices that map the global coordinate system to the 2 given coordinate systems.
With the availability of and θ, the rotation about axis can be naturally animated by gradually changing the rotation angle from 0 to θ. Eq. 3 shows the rotation matrix for an arbitrary intermediate angle ϕ (0 ≤ ϕ ≤ θ), yielding the intermediate display axes Aϕ = ARϕ, from whose x-y plane, a new image is reformatted for display, resulting in a “rotating” effect with ϕ running from 0 to θ.
Case Illustration: Assume the radiologist clicks the location indicated by a red circle in Figure 2(a), the system then generates a new image plane as shown in Figure 2(i), whereby the longitudinal axis of the vessel is aligned with the vertical centerline of the display window. The system also generates a movie that shows the transition between the two frames. Figure 2(b–h) show a few intermediate frames. The user also has the freedom to select a new location for further inspection by following the same vessel branch or jumping to a different vessel branch. For example, if the user clicks the location indicated by the blue circle in Figure 3(a), the system will move this new location to the center of the image plane as shown in Figure 3(b) and then automatically rotate the vessel axis to align with the vertical centerline for inspection, as shown in Figure 3(h).
Figure 2:

Illustration of Animation I: axis alignment. When the user clicks a point, the vessel will automatically rotate about this point to align its longitudinal axis with the vertical centerline of the display window.
Figure 3:

Illustration of Animation I: axis alignment. During the examination process, a new point may be selected within the same vessel branch or in different branches, as indicated by a blue circle at top right in (a). This new point first moves to the center of the image panel, and the vessel then automatically rotates around this new point to align its longitudinal axis with the vertical centerline. This vessel is free of PE.
3.2.2. Animation II: 360-degree tour
The second animation allows a 360-degree tour of the filling defect and the containing vessel while maintaining alignment of the vessel with the vertical axis of the display window. Each animated frame is constructed by interpolating the CT volume along and where denotes the vessel axis and denotes a rotation of by angle θ around the vessel axis, . Figure 4 shows a few frames from the 360-degree tour.
Figure 4:

Once its longitudinal axis is aligned with the vertical centerline, it will start spinning around the vertical line, providing compelling demonstration of the filling defect.
3.3. PE candidate classification
Although vessel orientation can be uniquely obtained for each candidate, there exists no unique pairs of that can span the cross-sectional plane. In fact, any pair can serve the purpose where and are computed by rotating and around vessel axis, , by θ degrees using Rodrigues’ rotation formula:
Therefore, we can obtain two imaging plane envelopes. The first envelope, Ecross, contains the cross sectional image planes, spanned by , and the second envelope, Elong, contains the longitudinal image planes spanned by , or . To generate a 3-channel image presentation for a PE candidate, we randomly select one image plane from Ecross and two image planes from Elong. The resulting image patch shows the PE candidate from 1 cross sectional view of the vessel and 2 longitudinal views of the vessel. Figure 5 illustrates this image representation.
Figure 5:

Overview of the context-aware image representation. (a) A subvolume around an embolus. (b) A small volume of interest (VOI) is centered on the candidate (the red dot). (c) A principle component analysis is performed in the VOI to determine the vessel axis v1 (the blue arrow) and the two orthogonal directions (v2 and v3). (d) A cross-sectional image plane (shown in blue) and longitudinal image plane (shown in green) are formed using v1, v2, and v3. (e) By rotating v2 and v3 around v1, a number of cross sectional and longitudinal image planes are obtained. (f) The rotated image planes can be grouped in 2 envelopes. (g) A 3-channel image representation for the embolus is generated by randomly selecting 1 image plane from the cross-sectional envelope and 2 image planes from the longitudinal envelope.
4. Properties of VOIR
Our suggested image representation has 4 properties:
- VOIR is compact because it concisely summarizes the 3D contextual information around emboli in only 3 image channels. As discussed before, a 3D image representation, although a seemingly obvious choice, can result in several complications: 1) it incurs substantially higher computational cost (3D convolution vs. 2D convolution), 2) it runs higher risk of over-fitting due to a higher dimensional feature space, 3) it limits the designer to shallower architectures due to the high storage requirement for the 3D activation maps, and 4) it slows down the training due to inability to utilize high quality 2D models pre-trained using ImageNet. Therefore, a compact image representation is highly advantageous.
(3)
VOIR is consistent with the orientation of the containing vessel. In general, emboli can affect pulmonary arteries in any orientation. As a result, images extracted from the axial, sagittal, coronal planes exhibit a significant amount of variation in the appearance of emboli. This in turn complicates the classification task and hinders effective utilization of CNNs. With the benefit of vessel alignment, VOIR allows for a standardized image representation whereby emboli consistently appear as elongated structures in the longitudinal vessel view and as circular structures in the cross-sectional vessel view. Figure 6 illustrates variations in PE appearance using the suggested image representation and a conventional image representation based on sagittal, coronal and axial views.
VOIR is expandable, supporting data augmentation, which is essential for effective training and testing of CNNs. In 2D applications, data augmentation is performed by applying arbitrary in-plane rotations and then collecting samples at multiple scales and translations. An image representation for 3D applications must also support the above operations to enable data augmentation. While it is straightforward to extend translation and scaling to a 3D space, the rotation operation can be problematic. Clearly, rotation around a random axis as in Roth et al. (2014) or around the standard x,y,z planes will not allow emboli to be displayed in a consistent, standardized fashion. VOIR addresses this need by selecting images from the cross section envelope, which is equivalent to rotating the cross sectional plane around the vessel axis v1. This is also the principle behind Animation II—360 degree tour of PE. Figure 7 illustrates consistency in appearance of PE under rotation-based data augmentation.
VOIR offers a multi-view representation of PE, allowing radiologists to confirm or exclude the presence of emboli with confidence . The two animations generated using our image representation namely, axis alignment and 360-degree tour, are also essential for rapid removal of false positive markings from any PE CAD system. False positives, if not visualized properly, can significantly prolong CTPA reading sessions, adversely affecting work-flow and impairing adoption of CAD technology in clinical practice.
Figure 6:

The suggested image representation (VOIR) characterizes emboli consistently in the cross sectional and longitudinal image planes. Note how the same emboli have an inconsistent appearance in the conventional image representation.
Figure 7:

Rotation-based data augmentation for an embolus using (a) the suggest image representation (VOIR), (b) a 2.5D approach, and (c) conventional image representation based on axial, sagittal, and coronal views. In each panel, the first row shows the resulting stacked channels and rows 2-4 show the individual channels. While VOIR maintains a consistent PE appearance with rotation-based data augmentation, the 2.5D approach and the conventional image representations fail to provide a consistent appearance.
5. Experiments
In this section, we first briefly explain our candidate generator and its performance when applied to our PE dataset. We then compare 2D CNN models trained using VOIR and the other competing 2D representations for the task of false positive reduction. Next, we compare our 2D false positive reduction model trained using VOIR with the 3D counterparts. Finally, we study robustness of our PE detection model to the choice of CT scanner machines as well as the physical size of crops used for training.
5.1. Candidate generation
As with other PE CAD systems, candidate generation is the first stage of our PE diagnosis system. We deploy a straightforward candidate generation method, consisting of lung segmentation followed by application of the tobogganing algorithm. We use a simple and heuristic lung segmentation method. Given a CT dataset, we first clip voxel intensities using an intensity threshold in order to identify the regions with low intensity values. This thresholding scheme results in a binary volume wherein the lung area and other dark regions in the volume appear white. We then perform a closing operation to fill the holes in the white volume. To exclude non-lung areas, we perform a 3D connected component analysis and remove components with small volumes or with large length ratio between the major and minor axes. The tobogganing algorithm is then applied only to the lung area, generating the PE candidates which we use as input to different image representations.
We applied our candidate generation method to a database of 121 CTPA datasets with a total of 326 emboli, producing 8585 PE candidates, of which 7722 were false positives and 863 were true positives. It is possible to produce multiple detections for a single large PE and that explains why the number of true detections is greater than the number of emboli in the database. According to the available ground truth, the candidate generation module achieves a sensitivity of 93% for PE detection while producing, on average, 65.8 false positives per patient. For the remainder of this paper, we ignore the emboli missed by our candidate generation method, which allows us obtain a sensitivity of 100% if at least one candidate per detected PE is labeled correctly. To use our entire database, we evaluate each image representation in a 3-fold cross validation scenario after splitting the database into 3 separate subsets at patient-level.
5.2. False positive reduction: VOIR vs. 2D representations
We evaluate VOIR in comparison with two 2D image representations for the task of false positive reduction. The competing approaches consist of the standard image representation that has axial, sagittal, and coronal planes around a given candidate location along the channel axis, and a 2.5D approach Roth et al. (2014); both are explained in Appendix A. For a rigorous comparison, we have trained six CNN architectures of various depths: a shallow CNN (sh-CNN) with 1 convolutional layer; the LeNet architecture LeCun et al. (1989); a relatively deep CNN (rd-CNN) with 4 convolutional layers whose deviations are commonly used in medical imaging applications Tajbakhsh et al. (2015c,d,a); Roth et al. (2015b,a, 2014), and three deeper CNN architectures named AlexNet Krizhevsky et al. (2012), VGG Simonyan and Zisserman (2014), and GoogleNet Szegedy et al. (2015). We trained sh-CNN, LeNet, and rd-CNN models from scratch after initalizing the weights using Xavier’s method Glorot and Bengio (2010). We initialized the deeper architectures with ImageNet pre-trained models, as recommended by Tajbakhsh et al. (2016). Each architecture above is trained in a 3-fold cross validation manner
Figure 8 shows the FROC curves grouped by architecture, and demonstrates that the impact of image representation on model performance depends on architecture depth, with shallower architectures benefiting most from a strong image representation. The performance gap caused by the choice of image representation is, however, closed to some extent using deeper architectures. JAFROC analysis indicates that the difference between VOIR and standard image representation is not significant in the case of AlexNet and VGGNet, although the gap widens in the case of GoogleNet. From Figure 8, we also observe that the standard image representation, in most cases, yields higher performance than the 2.5D approach.
Figure 8:

FROC analysis for different image representations grouped by architecture.
Figure 9 shows the same FROC curves grouped by image representation. The use of deeper architectures in the case of standard and 2.5D image representation is highly effective, yielding substantial performance improvement over the shallower models. However, in the case of VOIR, significantly lower performance gains are realized when shallower models are replaced with deeper architectures. This is because the suggested image representation leaves an easier problem for the convolutional models to solve; therefore, the performance gap between the deep and shallow models is not as wide. Nevertheless, the JAFROC analysis shows that the deepest model (GoogleNet) trained with VOIR achieves a significant performance gain over regular (p < .05) and 2.5D (p < .001) image representations. These results demonstrate the descriptive power of the suggested image representation and its robustness to the choice of model architecture.
Figure 9:

FROC analysis for different architectures grouped by image representation.
In Figure 9, we have also included the performance curve of a handcrafted approach Liang and Bi (2007) which, to our knowledge, is one of the best existing PE CAD systems in the literature. The handcrafted method generates a set of candidates using an improved tobogganing algorithm and then reduces the false positives by a specialized multi-instance classifier trained using a variety of carefully handcrafted shape and texture features. Not surprisingly, all the deep architectures, regardless of image representation, outperform the handcrafted approach. However, interestingly, the handcrafted approach outperforms shallower architectures if the latter are trained using standard or 2.5D image representation.
5.2.1. Size of training set
Adequately labeled training data is not always available for medical vision tasks. It is therefore important to evaluate the robustness of the image representations and architectures under study against the size of the training set. For this purpose, we re-trained the architectures after reducing the training set by 50% and 25% at the patient-level, and then computed the normalized partial area under each FROC curve (normalized pAUC) up to 3 FPs/Vol. The results are shown in Figure 10. To facilitate comparison among different image representations, in the legends we have included the change in normalized pAUC when the training set is reduced to 25%. As seen, the suggested VOIR shows the highest level of robustness (smallest drop in normalized pAUCs) against the size of the training set across the architectures of varying depths. Also, it is evident that deeper architectures trained using standard and 2.5D image representations with 25% of the training set outperform the shallower counterparts trained with the entire training set. This can be attributed to the embedded knowledge transferred from the ImageNet database.
Figure 10:

Normalized area under FROC curve (FPs/Vol<3) when 100%, 50%, 25% of training data are used for training different architectures. VOIR is the most robust image representation across different architectures.
5.2.2. Speed of convergence
We also investigated how the choice of image representation impacts the speed of convergence for the architectures used in our experiments. For this purpose, we saved the intermediate models during the training stage and then evaluated each model using the validation set by computing the area under the ROC curve. We measured the speed of convergence by averaging the AUCs of the intermediate models. The average AUC is, in fact, related to the area under the convergence curve, which is a 2D plot that has iteration numbers on the horizontal axis and the AUC at each iteration on the vertical axis. The higher the area under the convergence curve, the faster the convergence. Figure 11 compares the speed of convergence for each architecture and image representation. As seen, VOIR performs consistently better than the other 2 image representations. Furthermore, the superiority of VOIR over other representations is more pronounced for shallower architectures. This trend makes sense because deeper architectures start from a pre-trained model; thus, their convergence speed is less affected by the choice of image representation.
Figure 11:

Convergence speed comparison among different image representations across various architectures. A large average AUC indicates faster convergence.
5.2.3. Deeper architectures
In Section 5.2, we compared the suggested image representation with the competing approaches across architectures of varying depths with up to 19 convolutional layers. While the relatively small sizes of emboli in segmental and subsegmental pulmonary arteries may not support the use of deeper architectures, it is still interesting to study how deeper architectures would perform for the task of false positive reduction. For this purpose, we have trained DenseNet-121 Huang et al. (2017) and ResNet-101 He et al. (2016) from pre-trained ImageNet models using our image representation, and have further compared the results with that of the GoogleNet model. The results are shown in Figure 12. According to the JAFROC analysis, there is no significant difference among the 3 models, suggesting that deeper architectures yield to performance gain over the shallower counterpart. This performance trend can be attributed to the deeper models’ overfitting to our small training set, even though we regularized the deeper models during training using data augmentation, weight decay, and dropout layers.
Figure 12:

Comparison between GoogleNet, ResNet-101, and DenseNet-121 when trained using the suggested image representation. The JAFROC analysis shows no significant difference among the 3 models.
5.3. False positive reduction: VOIR vs. 3D representation
We have further compared VOIR with the 3D image representation for the task of false positive reduction. For this purpose, we have trained 3D ResNet-18 from Zhu et al. (2018) and an 8-layer 3D CNN from Ding et al. (2017) using 3D subvolumes around PE candidates. Since both architectures tended to overfit, we used heavy data augmentation including translation, scale, and rotation during training. We have shown the resulting FROC curves in Figure 13. The JAFROC analysis shows that the GoogleNet trained using VOIR significantly outperforms the 3D models (p < .001).
Figure 13:

Comparison between our suggested 2D representation (VOIR) and the 3D image representation. We have used two 3D architectures in our experiments: arch1 Ding et al. (2017), which is a plain CNN architecture with 8 convolution layers and arch2 Zhu et al. (2018), which is a residual network with 18 convolution layers. GoogleNet trained with VOIR significantly outperforms the 3D models.
5.4. Robustness analysis of our PE CAD
5.4.1. Choice of CT scanner machine
We have evaluated the performance of our best performing model (GoogleNet trained using VOIR) for different CT scanner machines. Our PE dataset consists of 33 scans by GE, 92 scans by Siemens, and 1 scan by Philips. We have discarded the single case acquired by the Philips scanner and obtained 2 FROC curves for the GE and Siemens cases. The results are shown in Figure 14. As seen, the FROC curves are nearly identical for the two scanners, suggesting that our model’s performance is fairly robust to the choice of CT scanner machines.
Figure 14:

Performance evaluation with respect to the choice of CT scanner machines. Our best model (GoogleNet trained with VOIR) performs comparably when tested on the GE and SIEMENS cases, suggesting that our model is fairly robust to the CT scanner.
5.4.2. Physical size of image crops
Pulmonary embolism can occur in central, segmental, or subsegmental pulmonary arteries. As such, the vessel containing emboli can vary in thickness and size. To ensure our PE detection model can handle this size variability, we have trained all architectures studied in Section 5.2 with various data augmentation including scale-based data augmentation where image crops of different physical sizes (10, 15, 20mm) are extracted around each PE candidate. Nevertheless, it is interesting to study the sensitivity of our CAD system to the physical size of crops. For this purpose, we have trained GoogleNet, the best performing architecture, using scale-specific training sets where the training crops in each set have the same physical size. The resulting FROC curves are shown in Figure 15. As seen, the models trained using scale-specific training sets perform comparably, suggesting that our PE CAD is robust to the physical size of crops. It is also observed that the model trained using the combined training set slightly outperforms the scale-specific models. Although this improvement is not statically significant, training the PE CAD using multi-scale crops seems to be more effective.
Figure 15:

Comparison between 2D GoogleNet models when trained using crops of varying physical sizes. The JAFROC analysis shows no significant difference among the models.
5.5. Participation in the CAD-PE challenge
We have evaluated our system using the entire 20 CTPA test datasets from the PE challenge3. We have compared our CAD with other participating teams in Table 2. This ranking is based on a zero localization error, that is, a detection is considered a true positive only if the detection is inside the ground truth for PE. In our opinion, optimizing performance at 0mm localization error provides greater advantage for clinical applications than greater performance at 2mm and 5mm localization errors (which are also used by the challenge organizers). As seen, our CAD system is ranked second among the participating teams, achieving a sensitivity of 33% at 2 false positives per scan. The winner of the challenge, UA-2D, has recently used an extended training set released by the challenge organizers, further improving their original submission. However, since this submission uses additional training data that is not used by other teams, we have excluded this method from the comparisons.
Table 2:
Comparison between the participating teams of the CAD-PE challenge. For each method, the sensitivity levels at 1 and 2 false positives per scan are reported. Some models miss one or both of these 2 operating points, in which case, an N/A is placed in the corresponding cell. One team, UA-2.5D, has had access to an extended training dataset, and is thus separated from the rest of the team.
| Team | Training set | Sensitivity |
|
|---|---|---|---|
| @ 1 FP | @ 2 FPs | ||
| UA-2D | 20 CTs | 37% | 43% |
| Ours: ASU-Mayo | 20 CTs | 28% | 33% |
| Mevis Inc. | 20 CTs | N/A | 28% |
| UPM | 20 CTs | 15% | 22% |
| FUM-Mvlab | 20 CTs | 7% | 22% |
| BWH | 20 CTs | 1% | 2.0% |
| LMNIT | 20 CTs | N/A | N/A |
| UA-2.5D | 71 CTs | 50% | 58% |
6. Discussion
Figure 9 shows that the handcrafted approach Liang and Bi (2007) outperforms shallow architectures (sh-CNN, LeNet, and rd-CNN), if the latter are trained using standard and 2.5D image representations. While this superiority demonstrates the competence of the handcrafted approach, it also indicates that the convolutional networks do not meet expectations if they are not trained with the proper image representation. In fact, it is only after using VOIR that shallower models outperform the hand-crafted approach. Therefore, designing the optimal image representation is a critical factor when training a high-performing classification model.
In Section 5.2.1, we showed that VOIR achieves the greatest robustness against the size of the training set. It is also interesting to note that, with VOIR, one can achieve a similar level of performance using a substantially smaller training set. For instance, the GoogleNet model trained using VOIR with 25% of the training set outperforms the GoogleNet models that are trained using other image representations with 50% of the training data. For VGG and AlexNet, it is a draw; that is, performance of VGG and AlexNet models trained using VOIR and 50% of the training data is comparable to these models when trained using other image representations with the full dataset. For shallower architectures, models trained using VOIR with 25% of the training data significantly outperform their counterparts trained using the full training set. These comparisons demonstrate how a suitable image representation compensates for limited training data.
Figure 10 shows that the normalized pAUC for all architectures improves as the training set grows in size. While this observation is expected, the curves show no evidence of performance plateau. In particular, the large increase in normalized pAUC for rd-CNN, GoogleNet, and AlexNet when their training set is changed from 50% to 100% indicates that these models could perform even better with additional training data, suggesting that the size of our training set is probably not adequate for the data-hungry deep convolutional models. We therefore surmise that a higher performing PE CAD system could be obtained using a larger training set.
We demonstrated in Figure 10 that GoogleNet trained with VOIR outperformed the 3D CNNs trained with a 3D representation. We attribute this superiority to the capabilities of VOIR in handling the curse of dimensionality and small sample size problem. First, VOIR mitigates the curse of dimensionality by condensing the essence of the 3D context around PE into a compact 2D representation, leaving an easier problem for 2D models to solve. A 3D representation, on the other hand, exposes the 3D models to a high dimensional input space, which in turn complicates the process of representation learning. Second, VOIR properly handles the small sample size problem by generating diverse augmented images. This is because each augmented image generated by VOIR is the result of projecting the 3D context into longitudinal and cross-sectional image planes; and thus, the augmented images are loosely correlated, exhibiting substantial variations in foreground and background appearance. A 3D representation, on the other hand, is handicapped by the small sample size problem, because traditional data augmentation in 3D may not increase the effective sample size substantially as the augmented image cubes often resemble the appearance of the original image cubes. We envision a higher level of performance for the 3D models through pre-training with self-supervised schemes—a research topic we are investigating, but it is beyond the scope of the current manuscript.
7. Conclusion
We have presented a novel vessel-oriented image representation and demonstrated how it can enhance visualization of suspected emboli detected by radiologists and emboli candidates identified by PE CAD systems. We also demonstrated that various CNN architectures trained using VOIR can significantly outperform their counterparts trained using standard and 2.5D image representations. Our experiments further showed that the models trained using VOIR were more robust against the size of training set, exhibiting less performance degradation when the training set is halved or quartered in size. Our experiments also showed that architectures trained using VOIR would require substantially smaller training sets to achieve performance equivalent to other image representations. We also compared the convergence speed of the models trained using the 3 image representations, concluding that VOIR enables the fastest convergence for the architectures under study. Additionally, we demonstrated that 2D models trained using our image representation achieved a significant gain over the 3D models trained using the standard 3D presentation. Finally, our CAD system in ranked second in the CAD-PE challenge in the category of 0mm localization error.
Highlights.
Our vessel-oriented image representation (VOIR) is compact, effcient, and discriminative
VOIR facilitates pulmonary embolism diagnosis for both radiologists and CAD systems
VOIR boosts detection performance, requires fewer training samples, and accelerates the training process
VOIR offers 360 vessel visualization, enabling radiologists to diagnose with confidence
Our CAD powered by VOIR is ranked first in the PE challenge at 0mm localization error
Acknowledgments
The authors would like to thank Prof. Chakraborty for his helpful advice on JAFROC analysis and Douglas Amoo-Sargon for performing the statistical analyses. This research has been supported partially by ASU and Mayo Clinic through a Seed Grant and partially by NIH under Award Number R01HL128785. The content is solely the responsibility of the authors and does not necessarily represent the official views of NIH.
Appendix A. Other image representations
Given a CT volume V and a candidate location c = [cx, cy, cz], we considered 2 additional image representations for comparison: a standard image representation and a 2.5D approach. In the following, we briefly explain these 2 image representations.
Appendix A.1. Standard image representation
The standard image representation consists of extracting 3 crops form the conventional planes (sagittal, coronal, and axial planes)
that are further stacked to form an rgb-like image. Data augmentation is performed by moving c along a random direction, by rotating the axial plane around the z-axis by a random degree, and by interpolating the 3 standard planes at different resolutions.
Appendix A.2. 2.5D image representation
The 2.5D image representation begins with extracting a subvolume Vc around the candidate location, followed by rotating it around a randomly oriented vector, resulting in a rotated subvolume, . Next, three crops are extracted from the new sagittal, coronal, and axial planes,
and then stacked to form an rgb-like image. For orientation-based data augmentation, one can choose several rotation angles at random. For translation-based data augmentation, one can move the center of the subvolume along a random direction. Scaling can also be implemented by interpolating the new planes at different resolutions.
Footnotes
Publisher's Disclaimer: This is a PDF file of an unedited manuscript that has been accepted for publication. As a service to our customers we are providing this early version of the manuscript. The manuscript will undergo copyediting, typesetting, and review of the resulting proof before it is published in its final citable form. Please note that during the production process errors may be discovered which could affect the content, and all legal disclaimers that apply to the journal pertain.
VOIR means “see” in French. In analogy, our representation helps radiologists better see the emboli.
Selected as a finalist for a young scientist award
References
- Al-hinnawi ARM, Al-Naami BO, Al-azzam H, 2018. Collaboration between interactive three-dimensional visualization and computer aided detection of pulmonary embolism on computed tomography pulmonary angiography views. Radiological Physics and Technology 11, 61–72. URL: 10.1007/s12194-017-0438-x, doi: 10.1007/s12194-017-0438-x. [DOI] [PubMed] [Google Scholar]
- Bouma H, Sonnemans JJ, Vilanova A, Gerritsen FA, 2009. Automatic detection of pulmonary embolism in cta images. Medical Imaging, IEEE Transactions on 28, 1223–1230. [DOI] [PubMed] [Google Scholar]
- Buhmann S, Herzog P, Liang J, Wolf M, Salganicoff M, Kirchhoff C, Reiser M, Becker CH, 2007. Clinical evaluation of a computer-aided diagnosis (cad) prototype for the detection of pulmonary embolism. Academic radiology 14, 651–658. [DOI] [PubMed] [Google Scholar]
- Calder KK, Herbert M, Henderson SO, 2005. The mortality of untreated pulmonary embolism in emergency department patients. Annals of emergency medicine 45, 302–310. URL: 10.1016/j.annemergmed.2004.10.001, doi: [DOI] [PubMed] [Google Scholar]
- Ciresan D, Meier U, Schmidhuber J, 2012. Multi-column deep neural networks for image classification, in: Computer Vision and Pattern Recognition (CVPR), 2012 IEEE Conference on, IEEE. pp. 3642–3649. [Google Scholar]
- Craig JJ, . Introduction to robotics: mechanics and control. volume 3. [Google Scholar]
- Ding J, Li A, Hu Z, Wang L, 2017. Accurate pulmonary nodule detection in computed tomography images using deep convolutional neural networks, in: International Conference on Medical Image Computing and Computer-Assisted Intervention, Springer. pp. 559–567. [Google Scholar]
- Engelke C, Schmidt S, Bakai A, Auer F, Marten K, 2008. Computer-assisted detection of pulmonary embolism: performance evaluation in consensus with experienced and inexperienced chest radiologists. European radiology 18, 298–307. [DOI] [PubMed] [Google Scholar]
- Fairfield J, 1990. Toboggan contrast enhancement for contrast segmentation, in: Pattern Recognition, 1990. Proceedings., 10th International Conference on, IEEE. pp. 712–716. [Google Scholar]
- Glorot X, Bengio Y, 2010. Understanding the difficulty of training deep feedforward neural networks, in: International conference on artificial intelligence and statistics, pp. 249–256. [Google Scholar]
- He K, Zhang X, Ren S, Sun J, 2016. Deep residual learning for image recognition, in: Proceedings of the IEEE conference on computer vision and pattern recognition, pp. 770–778. [Google Scholar]
- Huang G, Liu Z, Van Der Maaten L, Weinberger KQ, 2017. Densely connected convolutional networks, in: Proceedings of the IEEE conference on computer vision and pattern recognition, pp. 4700–4708. [Google Scholar]
- Krizhevsky A, Sutskever I, Hinton GE, 2012. Imagenet classification with deep convolutional neural networks, in: Advances in neural information processing systems, pp. 1097–1105. [Google Scholar]
- LeCun Y, Boser B, Denker JS, Henderson D, Howard RE, Hubbard W, Jackel LD, 1989. Backpropagation applied to handwritten zip code recognition. Neural computation 1, 541–551. [Google Scholar]
- Liang J, Bi J, 2007. Computer aided detection of pulmonary embolism with tobogganing and multiple instance classification in CT pulmonary angiography, in: Information Processing in Medical Imaging, Springer. pp. 630–641. [DOI] [PubMed] [Google Scholar]
- Maizlin ZV, Vos PM, Godoy MB, Cooperberg PL, 2007. Computer-aided detection of pulmonary embolism on ct angiography: initial experience. Journal of thoracic imaging 22, 324–329. [DOI] [PubMed] [Google Scholar]
- Masoudi M, Pourreza HR, Saadatmand-Tarzjan M, Eftekhari N, Zargar FS, Rad MP, 2018. A new dataset of computed-tomography angiography images for computer-aided detection of pulmonary embolism, in: Scientific data [DOI] [PMC free article] [PubMed] [Google Scholar]
- Özkan H, Osman O, Sahin S, Boz AF, 2014. A novel method for pulmonary embolism detection in cta images. Computer methods and programs in biomedicine 113, 757–766. [DOI] [PubMed] [Google Scholar]
- Park SC, Chapman BE, Zheng B, 2011. A multistage approach to improve performance of computer-aided detection of pulmonary embolisms depicted on CT images: Preliminary investigation. Biomedical Engineering, IEEE Transactions on 58, 1519–1527. [DOI] [PubMed] [Google Scholar]
- Prasoon A, Petersen K, Igel C, Lauze F, Dam E, Nielsen M, 2013. Deep feature learning for knee cartilage segmentation using a triplanar convolutional neural network, in: Medical Image Computing and Computer–Assisted Intervention-MICCAI 2013. Springer, pp. 246–253. [DOI] [PubMed] [Google Scholar]
- Roth H, Lu L, Seff A, Cherry K, Hoffman J, Wang S, Liu J, Turkbey E, Summers R, 2014. A new 2.5d representation for lymph node detection using random sets of deep convolutional neural network observations, in: Golland P, Hata N, Barillot C, Hornegger J, Howe R. (Eds.), Medical Image Computing and Computer-Assisted Intervention MICCAI 2014 Springer International Publishing; volume 8673 of Lecture Notes in Computer Science, pp. 520–527. doi: 10.1007/978-3-319-10404-1_65. [DOI] [PMC free article] [PubMed] [Google Scholar]
- Roth H, Yao J, Lu L, Stieger J, Burns J, Summers R, 2015a. Detection of sclerotic spine metastases via random aggregation of deep convolutional neural network classifications, in: Yao J, Glocker B, Klinder T, Li S. (Eds.), Recent Advances in Computational Methods and Clinical Applications for Spine Imaging Springer International Publishing; volume 20 of Lecture Notes in Computational Vision and Biomechanics, pp. 3–12. doi: 10.1007/978-3-319-14148-0_1. [DOI] [Google Scholar]
- Roth HR, Farag A, Lu L, Turkbey EB, Summers RM, 2015b. Deep convolutional networks for pancreas segmentation in ct imaging, in: SPIE Medical Imaging, International Society for Optics and Photonics. pp. 94131G–94131G. [Google Scholar]
- Roth HR, Lu L, Liu J, Yao J, Seff A, Kevin C, Kim L, Summers RM, 2016. Improving computer-aided detection using convolutional neural networks and random view aggregation. To appear in IEEE Transaction in Medical Imaging . [DOI] [PMC free article] [PubMed] [Google Scholar]
- Sadigh G, Kelly AM, Cronin P, 2011. Challenges, controversies, and hot topics in pulmonary embolism imaging. American Journal of Roentgenology 196 URL: 10.2214/AJR.10.5830, doi: 10.2214/AJR.10.5830. [DOI] [PubMed] [Google Scholar]
- Setio AAA, Ciompi F, Litjens G, Gerke P, Jacobs C, van Riel SJ, Wille MMW, Naqibullah M, Sánchez CI, van Ginneken B, 2016. Pulmonary nodule detection in ct images: false positive reduction using multiview convolutional networks. IEEE transactions on medical imaging 35, 1160–1169. [DOI] [PubMed] [Google Scholar]
- Simonyan K, Zisserman A, 2014. Very deep convolutional networks for large-scale image recognition. arXiv preprint arXiv:1409.1556 . [Google Scholar]
- Szegedy C, Liu W, Jia Y, Sermanet P, Reed S, Anguelov D, Erhan D, Vanhoucke V, Rabinovich A, 2015. Going deeper with convolutions, in: Proceedings of the IEEE Conference on Computer Vision and Pattern Recognition, pp. 1–9. [Google Scholar]
- Tajbakhsh N, Gotway MB, Liang J, 2015a. Computer-aided pulmonary embolism detection using a novel vessel-aligned multi-planar image representation and convolutional neural networks, in: International Conference on Medical Image Computing and Computer-Assisted Intervention, Springer. pp. 62–69. [Google Scholar]
- Tajbakhsh N, Gurudu S, Liang J, 2015b. Automated polyp detection in colonoscopy videos using shape and context information. Medical Imaging, IEEE Transactions on PP, 1–1. doi: 10.1109/TMI.2015.2487997. [DOI] [PubMed] [Google Scholar]
- Tajbakhsh N, Gurudu SR, Liang J, 2015c. Automatic polyp detection in colonoscopy videos using an ensemble of convolutional neural networks, in: Biomedical Imaging (ISBI), 2015 IEEE 12th International Symposium on, IEEE pp. 79–83. [Google Scholar]
- Tajbakhsh N, Gurudu SR, Liang J, 2015d. A comprehensive computer-aided polyp detection system for colonoscopy videos, in: Information Processing in Medical Imaging, Springer. pp. 327–338. [DOI] [PubMed] [Google Scholar]
- Tajbakhsh N, Shin JY, Gurudu SR, Hurst RT, Kendall CB, Gotway MB, Liang J, 2016. Convolutional neural networks for medical image analysis: Full training or fine tuning? IEEE transactions on medical imaging 35, 1299–1312. [DOI] [PubMed] [Google Scholar]
- Wang X, Song X, Chapman BE, Zheng B, 2012. Improving performance of computer-aided detection of pulmonary embolisms by incorporating a new pulmonary vascular-tree segmentation algorithm, in: SPIE Medical Imaging, International Society for Optics and Photonics. pp. 83152U–83152U. [Google Scholar]
- Zhou C, Chan HP, Patel S, Cascade PN, Sahiner B, Hadjiiski LM, Kazerooni EA, 2005. Preliminary investigation of computer-aided detection of pulmonary embolism in three-dimensional computed tomography pulmonary angiography images 1. Academic radiology 12, 782–792. [DOI] [PMC free article] [PubMed] [Google Scholar]
- Zhou Z, Shin J, Zhang L, Gurudu S, Gotway M, Liang J, 2017. Fine-tuning convolutional neural networks for biomedical image analysis: actively and incrementally, in: Proceedings of the IEEE conference on computer vision and pattern recognition, pp. 7340–7351. [DOI] [PMC free article] [PubMed] [Google Scholar]
- Zhu W, Vang YS, Huang Y, Xie X, 2018. Deepem: Deep 3d convnets with em for weakly supervised pulmonary nodule detection, in: International Conference on Medical Image Computing and Computer-Assisted Intervention, Springer. pp. 812–820. [Google Scholar]